26
FebruaryPer Stirling Capital Outlook – February

“History does not repeat itself, but it oftentimes rhymes”. -Mark Twain
“When they were hot, they were very, very hot. But when they were not, they were losers.
The story of the stock market … was of stocks that flew higher than at any time in the last decade. Enough of them soared that the major market indexes all closed the year at record highs. The best-performing stocks leaped not by hundreds, but by thousands of percentage points. Applying that standard, it was the year of the decade.
And yet, all that prosperity hid some weaknesses. With interest rates rising … many stocks struggled. The Standard & Poor’s index of 500 stocks gained 19.5 percent during the year, but more issues in the index fell than rose.
The Nasdaq composite index leaped 85.6 percent — a performance that exceeded the gain for any major index in any year in the history of stock markets in the United States. But there were a lot of Nasdaq losers as well, and the index of financial stocks listed on that market ended the year down 9 percent.” 1
The market overview quoted above was taken from a January 3rd article in the New York Times. More specifically, it was published on January 3rd of the year 2000, and the article was titled THE YEAR IN THE MARKETS; 1999: Extraordinary Winners and More Losers.
This is of course noteworthy, as any of our readers (and most other informed investors), could have very reasonably concluded that the above was written just over a month ago, and that the year under review was, in fact, 2023.
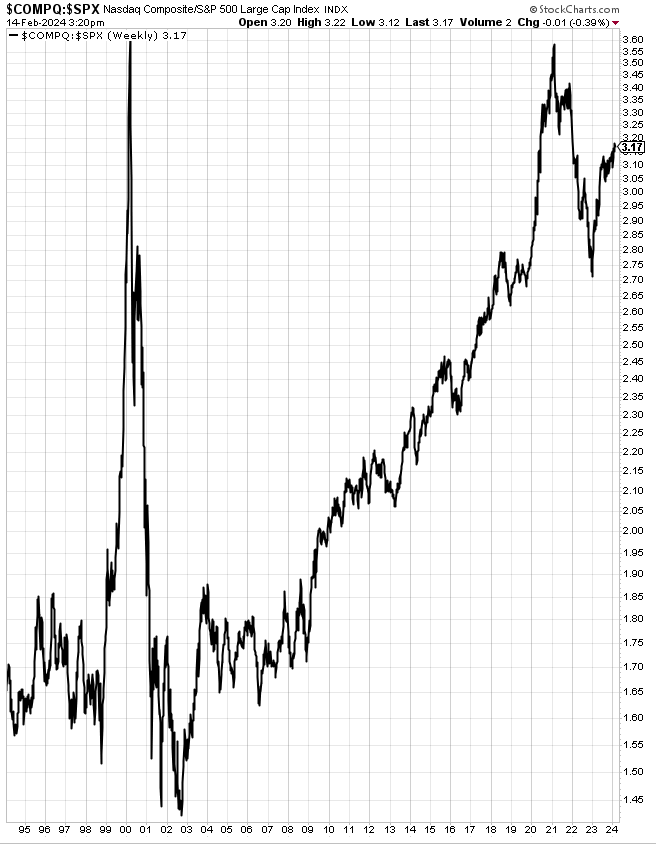
Many examples of the two time periods at least “rhyming” are self-evident, including the above ratio chart that divides the high-tech-dominated NASDAQ Composite Index by the S&P 500 Index. This chart thus illustrates the period of prolonged and dramatic outperformance by technology stocks (and other “growthier” parts of the stock market) that has characterized recent years, and which is eerily reminiscent of the mid-to-late 1990s, a period closely associated with Fed Chairman Greenspan’s famous 1996 speech that questioned whether the stock market was showing signs of “irrational exuberance”.
Given the seminal importance of this period in the history of global equity markets, and the increasing frequency with which we see analysts, investors, “talking heads” and even colleagues comparing that period with the present, we will take the opportunity of this commentary to consider the increasingly compelling question of whether history is currently being repeated, or is it just “rhyming”.
While the current dominance of technology stocks certainly “rhymes” with the late 1990s period (technology stocks now represent more than 30% of the S&P 500 for the first time since 2000) 2, the leadership is even more concentrated today, with the so-called “Magnificent 7” stocks (Amazon, Apple, Google, Meta, Microsoft, Nvidia and Tesla) absolutely dominating market performance.
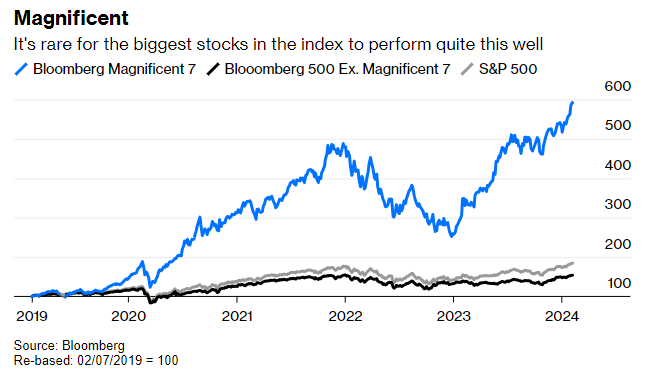
The “Bloomberg Magnificent 7 Index” (shown above) illustrates that, even despite a ferocious NASDAQ bear market in 2022, the overwhelming majority of the past five years’ worth of gains in the domestic equity markets have come from those seven mega-cap technology stocks. This index weights these seven stocks in equal proportions and rebalances those weightings on a quarterly basis. 3
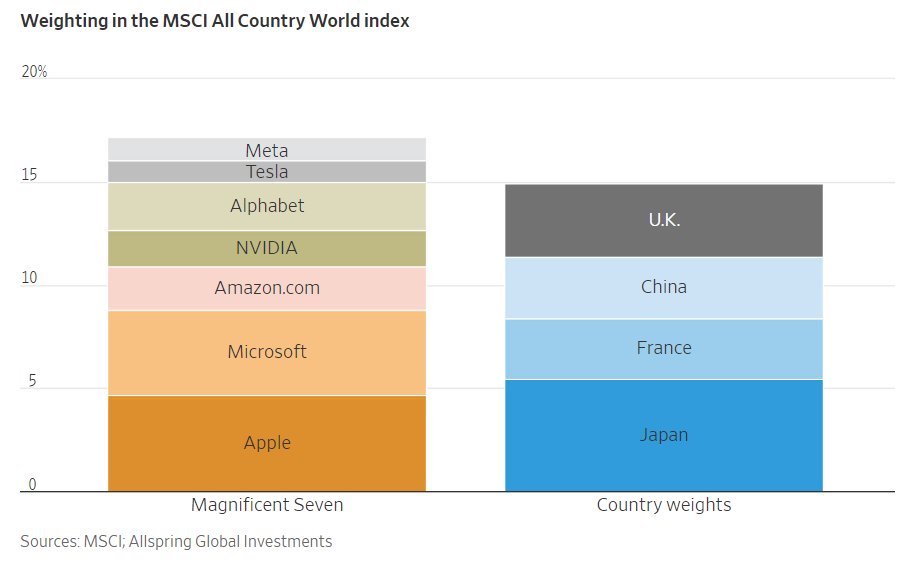
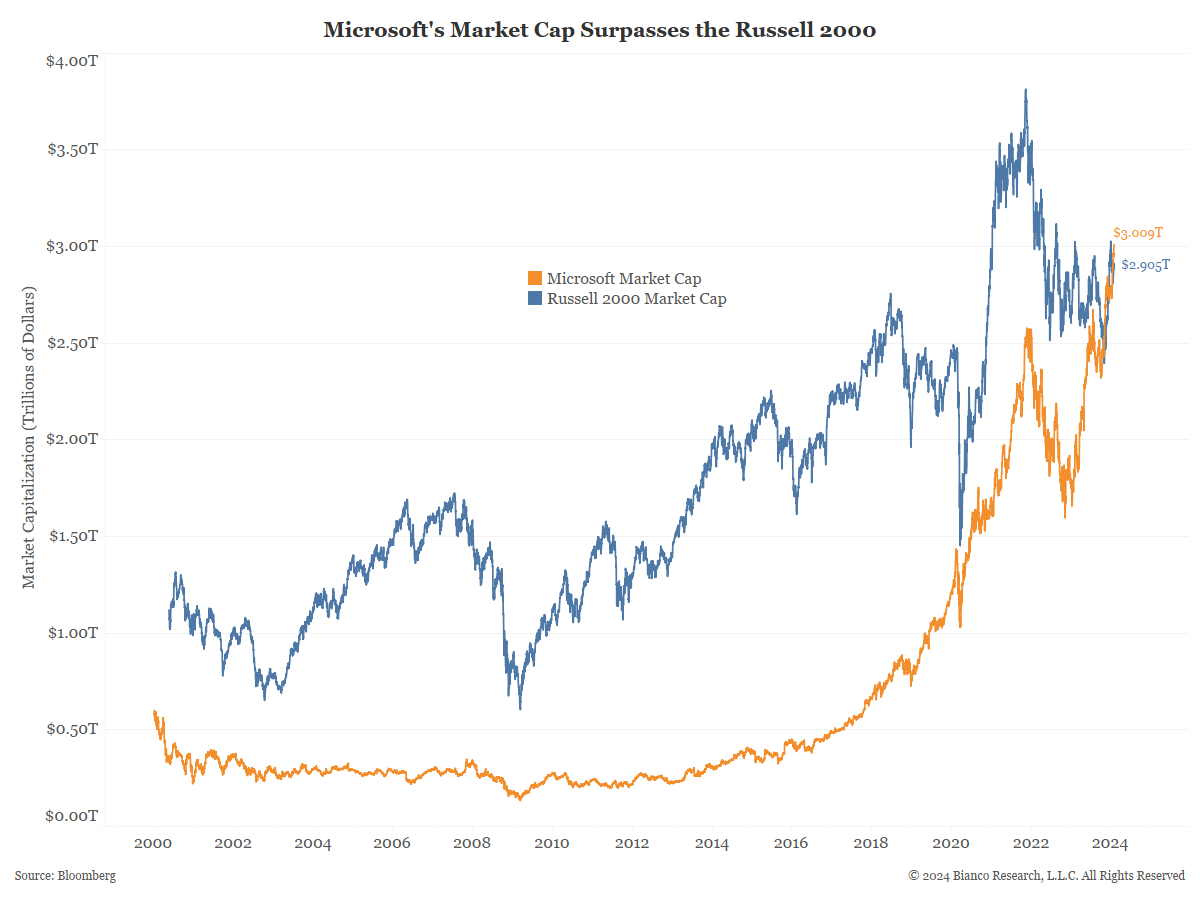
To offer some appreciation of just how massive these companies are, the market capitalization (the combined value of all outstanding shares in only five of those seven companies, excluding Meta and Tesla) is equal to the combined market value of all stocks listed in the United Kingdom, China, France and Japan. Of note, China and Japan represent the second and third largest stock markets in the world. Apple and Microsoft individually are each more valuable than all of the stocks in the Russell 2000 Index (of small and mid-capitalization stocks) combined.
Market concentration is now at its highest level since the early 1970s 4, which is further complicated by the market’s very narrow breadth, with value-oriented stocks, high-dividend stocks and smaller stocks dramatically underperforming, which is also very similar to the late 1990s environment, and the trend certainly appears to have carried over into 2024.
According to a recent report from Bespoke, “The S&P 500 finished January up 1.6%, but the average stock in the cap-weighted index was down 0.8% during the month. Of the index’s 500 members, 279 fell in January while just 221 rose.” 5
Their research also emphasized the continued dominance of very large and highly priced stocks. Specifically, regarding the large-cap Russell 1000 Index, “the 100 stocks that began 2024 with the lowest share prices fell an average of 7.4% in January, while the 100 stocks with the highest share prices rose an average of 2.0%. Additionally, the 41 Russell 1,000 stocks that began the year with a $500+ share price rose 3.2% in January, while the 25 sub-$10 stocks fell 11.0%”. 6
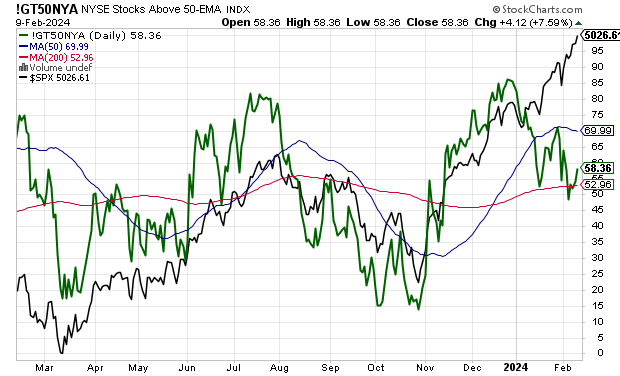
You can see this very poor market breadth (the number of stocks participating in the advance) reflected in the above chart, which shows the S&P 500 Index hitting new all-time highs (in black), but with only a paltry 58% of New York Stock Exchange-listed stocks currently trading higher than their average price of the last 50 trading days (in green). In other words, 42% of listed stocks are not participating in this leg of the bull market.
Importantly, history shows that a relatively few very large and heavily weighted stocks can power a bull market for much longer than logic would suggest, particularly during periods of revolutionary technological innovation (railroads, automobiles, radio, television, transistors, personal computers, internet, cloud computing and presumably artificial intelligence).
Furthermore, many major bull markets begin with narrow breadth, only to have the market broaden out into a full-fledged bull market with broad participation across sectors, market capitalizations and even geographies. This is our expectation of this market cycle as well, and there are some hopeful, albeit very early, signs that such an improvement in market breadth may be underway.
However, until such time as the market does broaden out to more stocks, presumably in response to rate cuts and dovish guidance from the Fed, there is an idiosyncratic risk that, if the stocks or sectors providing that narrow leadership fall out of favor because they become unjustifiably overvalued or experience deteriorating fundamentals, the broader market may not be there to help cushion any decline in the major indexes. While that is certainly not our base case, it is a potential risk that we are paying attention to.
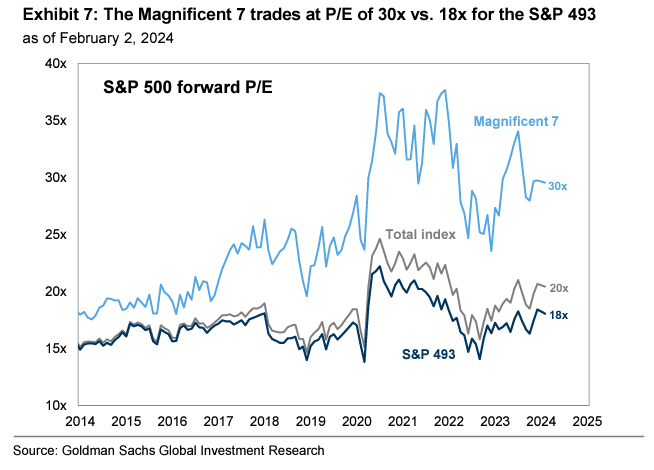
Of course, just as was the case at the start of the new millennium, another risk of highly concentrated markets, where a very disproportionate percentage of investor money is pouring in a select few stocks, is that those few stocks can reach very lofty valuations. This is certainly true again today, when the “Magnificent 7” stocks are priced at 30 times their expected 12-month earnings, which is 66% higher than that of the S&P 500 excluding those seven stocks and 50% higher than the S&P 500 as a whole (see the above chart).
Another set of risks has to do with sentiment and positioning. Specifically, with these stocks already so heavily represented in investor portfolios, and everyone seemingly already incredibly bullish on them, it does raise the question of just who is left to keep buying them, which we acknowledge as a potential risk in the short term.
Without question, the stock market is very highly concentrated, it is highly dominated by technology stocks, with an emphasis on the technology behemoths, and there are some signs of speculative excess. As such, there are clearly some uncomfortable similarities (rhyming) with the bursting of the internet bubble around a quarter century ago.
However, we also see an equally impressive array of differences between the two periods, starting with the quality of the companies involved and the afore-mentioned valuations. For example, the “Magnificent 7” stocks are presently selling at a lofty 41 times trailing earnings 7 and 30 times expected earnings. By contrast, the NASDAQ peaked out in March of 2000 at an astonishing 175 times its trailing earnings. 8
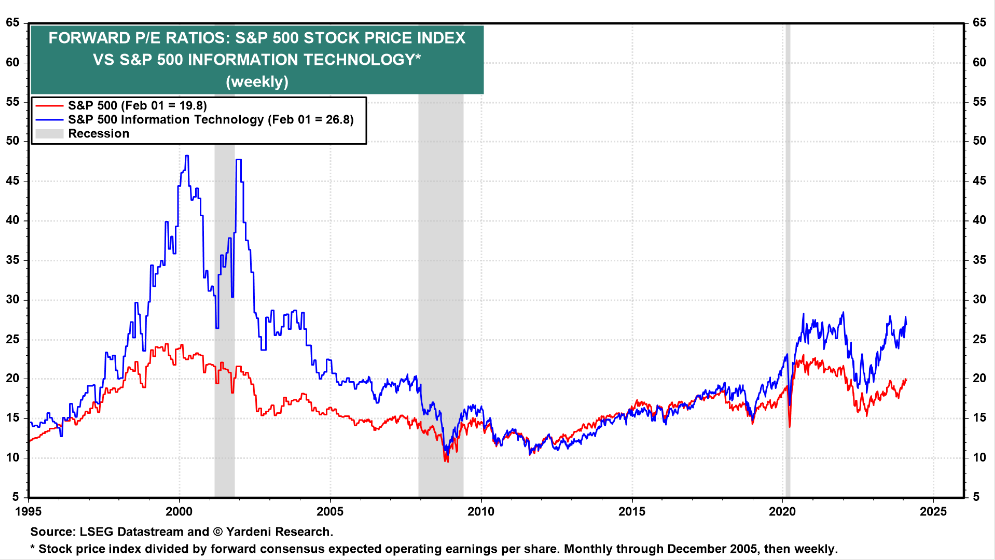
As you can see above, the same is basically true of the technology sector as a whole, which was valued at around 50 times expected earnings at the time of the technology bubble (i.e., twice the valuation of the S&P 500). By contrast, today’s technology stocks are valued at around 28 times expected earnings, which is still 40% higher than S&P 500 valuations. However, as you can see, technology stocks normally trade at a premium to the S&P 500.
Even more important is the difference in the quality, sustainability, and profitability of today’s leading technology companies versus those of the Y2K technology bubble, which were largely funded by venture capital, and many of which went bankrupt after failing to ever reach profitability. Without profits to measure them by, many technology companies were assigned massive valuations based on suspect criteria like how many “eyeballs” viewed their website.
We believe that the environment today is very different, with the technology leaders (potentially aside from Tesla) being among the highest quality, most sustainable companies on earth, and instead of being the speculative frenzy stocks of 25 years ago, most of the current leaders are viewed as safe harbor stocks that investors flee to in times of market turbulence or economic distress.
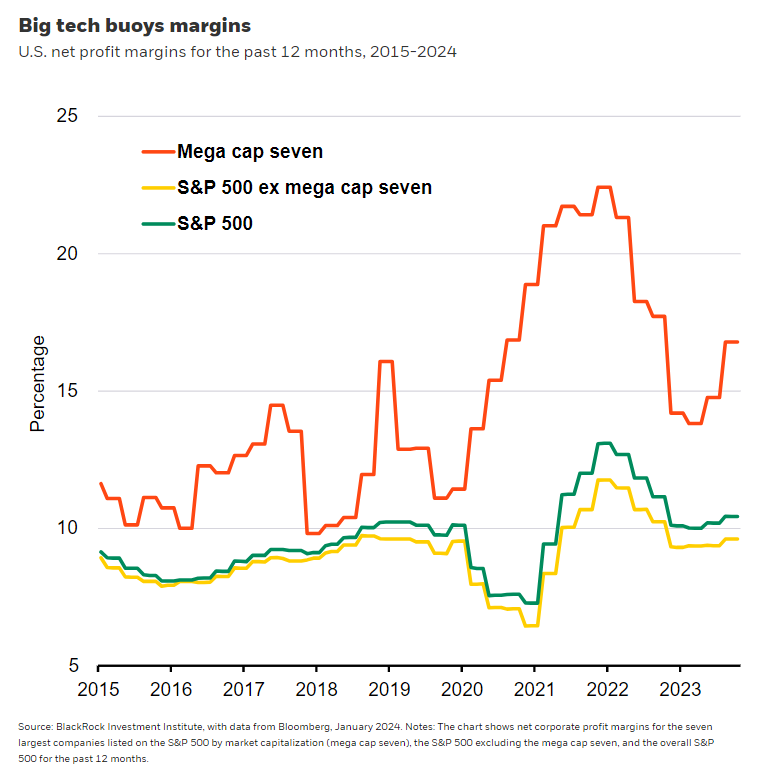
They also have profit margins that are far in excess of the general market, which means that a larger percentage of each incremental increase in revenues flows to the bottom line as profits. Indeed, while the S&P 500 maintains profit margins of around 11% and the S&P 500 companies excluding the “Magnificent 7” stocks average profit margins of just over 9%, “Magnificent 7” stocks average profit margins of over 17%, which is 70% higher than the average S&P 500 stock.
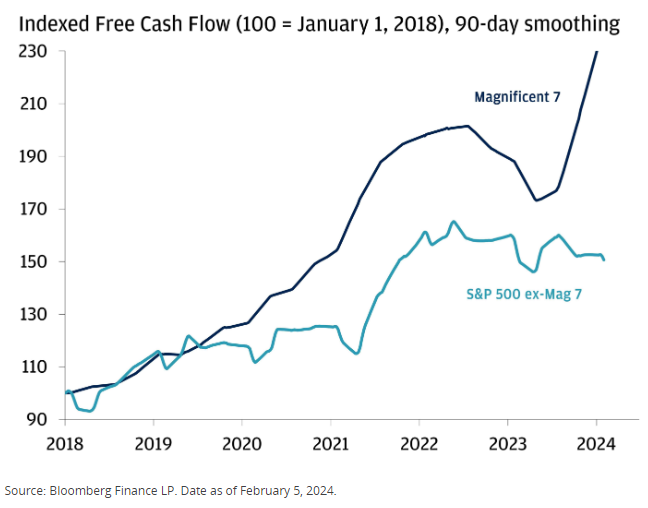
In addition to having extraordinary margins and strong revenue growth, these mega-cap technology stocks boast remarkable levels of free cash flow, which is of critical importance to high growth companies (and of great interest to many investors), as free cash flow allows companies to pay dividends, buy back shares, retire debt, and invest in research and new growth opportunities.
All things considered, the attributes that most investors probably admire most about these companies are their nominal level of current earnings, and perhaps even more importantly, the growth rate in those earnings.
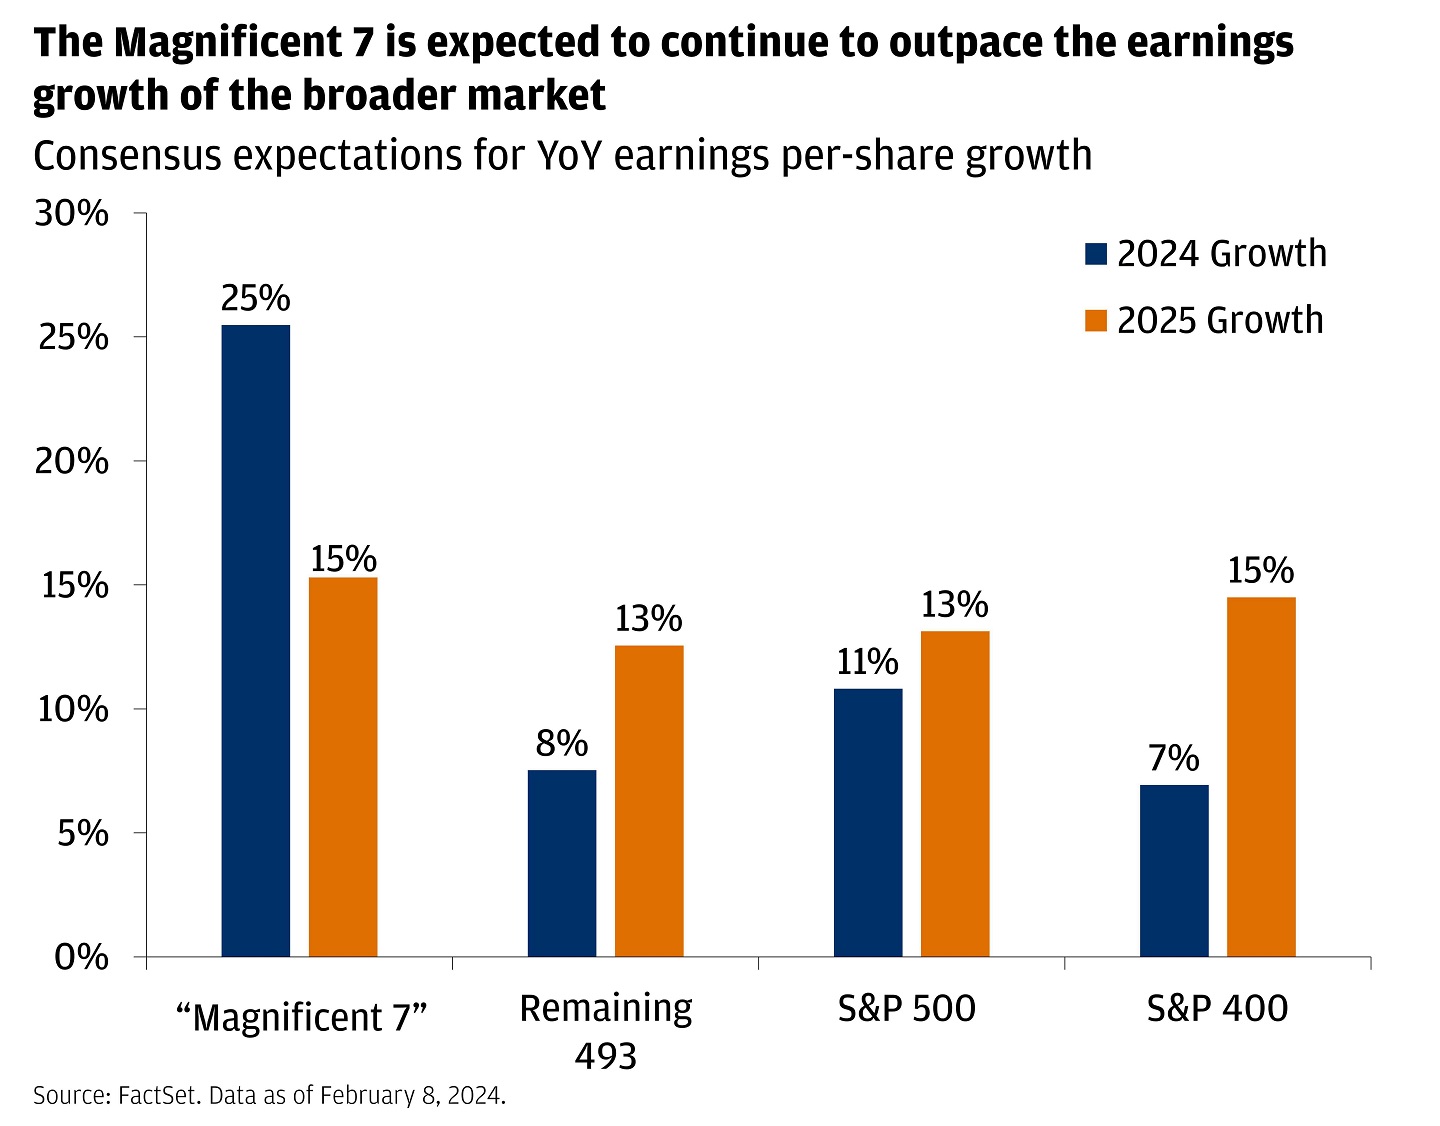
In terms of current earnings, these seven stocks are expected to produce almost 20% of the total combined earnings of all 500 companies represented in the S&P 500.9 Even more impressive is that this trend is expected to continue, despite expectations for a broadening market.
This is not to suggest that these mega-cap technology stocks are not expensive, particularly based upon current earnings. They are.
However, we believe that this measure fails to take into consideration what may be the single most important attribute of these stocks (assuming that analyst’s estimates are reasonably accurate) and that is the aforementioned growth rate in earnings.
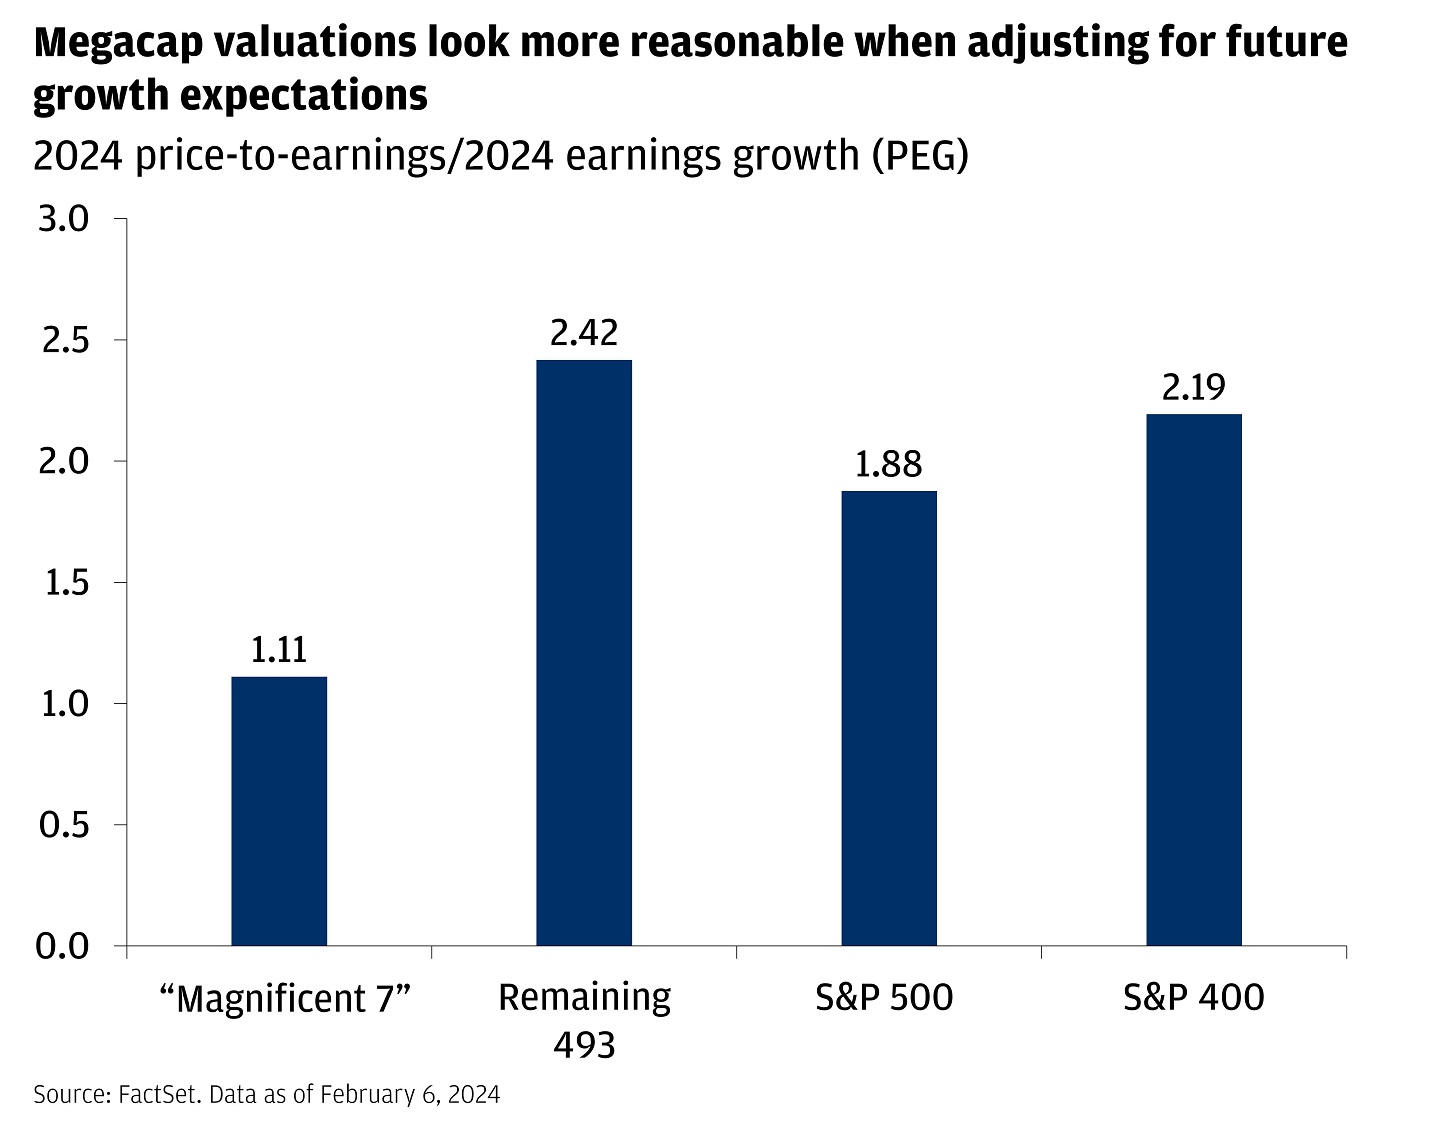
If you take this factor into consideration by looking at the PEG Ratio, which divides the current price-to-earnings multiple by the growth rate in earnings, these stocks do not look so expensive after all, particularly on a multi-year basis. Indeed, based upon the PEG ratio, one can make the argument that the “Magnificent 7” stocks are actually fairly inexpensive on a relative basis.
Furthermore, while these mega-cap stocks trade at a P/E premium to the rest of the S&P 500, when comparing the aggregate forward price-to-earnings ratio to history, it is roughly in line with the 10-year trailing average. 10
In short, we think that history is “rhyming” rather than repeating and, rather than being an imprudent source of speculative risk, that these mega-cap technology stocks should continue to play an important role in growth portfolios. Further, we believe that current valuations for the “Magnificent 7” stocks are not unreasonable, when you consider the rate of acceleration in expected earnings growth.
All of the above being true, it is important to keep in mind that such stocks that are more highly valued tend to be more susceptible to decline when they fail to meet market expectations. The average stock is not so expensive and thus is less susceptible to this risk.
Indeed, while broad market valuations are above historic averages, this condition is largely as a result of these more highly valued “Magnificent 7” stocks and the large influence that they have on overall index valuations. In other words, the high valuations on mega-cap technology are making the rest of the market look more expensive than it actually is.
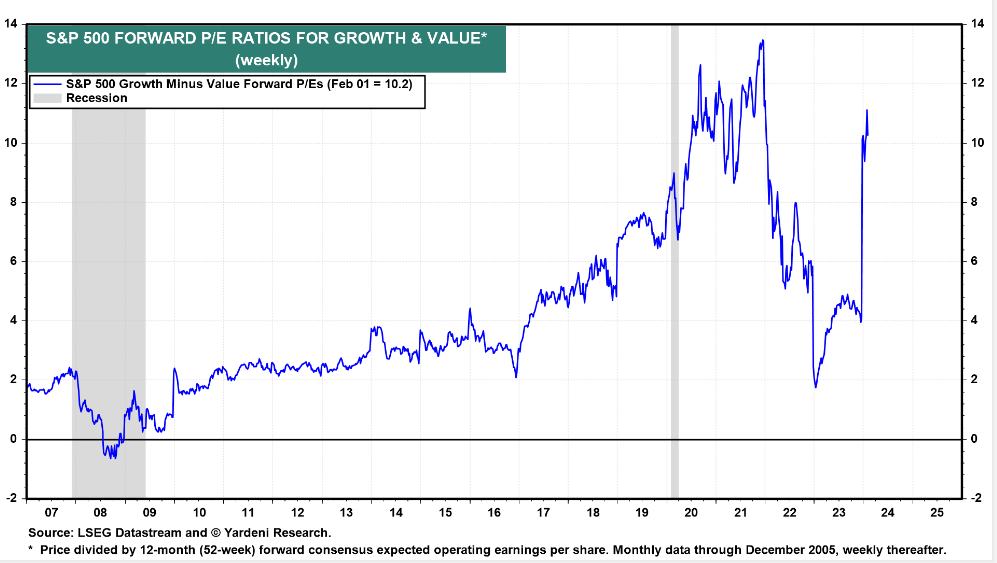
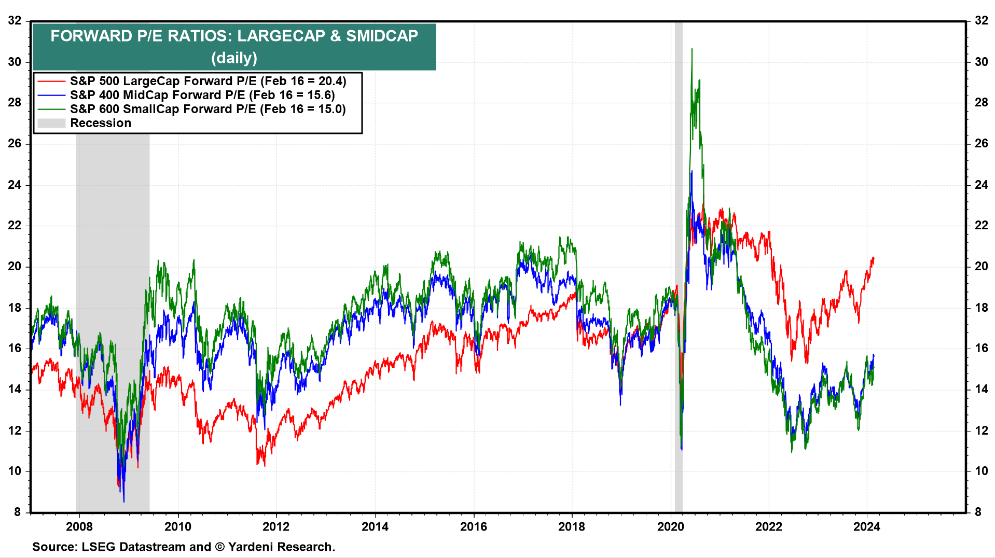
Further, more than a third of S&P 500 stocks are still down since the start of 2023 11, and value stocks are approaching historic levels of undervaluation compared to growth stocks (see the above growth/value chart). Moreover, small-cap and mid-cap stocks look very inexpensive relative to both large-capitalization stocks and to their own historic valuations.
While it may take actual interest rate reductions (not just forward guidance) from the Fed to catalyze the long-awaited broadening out of the markets beyond the large-cap technology sector, we do think that such rate cuts are just a matter of time.
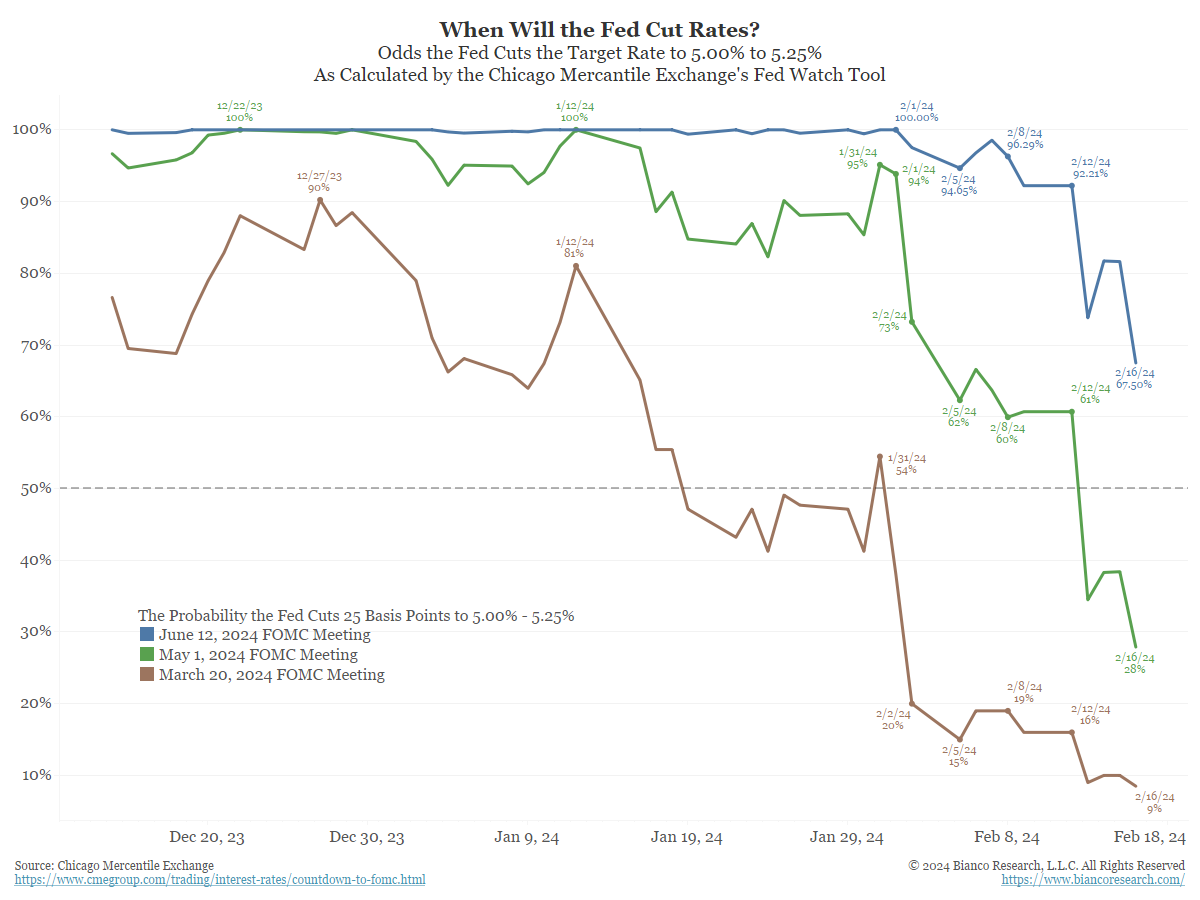
In the immediate term, stronger than expected economic growth and more stubborn than expected inflation are causing investors to push back their expectations for the timing and scope of rate cuts, and this is likely to exacerbate near-term volatility. However, like being a passenger at a train station, while you cannot dictate the time of departure, you can see what direction the train is headed, and we think that rates are ultimately headed lower and that the broad equity markets will ultimately join mega-cap technology stocks in this year’s impressive uptrend.
Disclosures
Advisory services offered through Per Stirling Capital Management, LLC. Securities offered through B. B. Graham & Co., Inc., member FINRA/SIPC. Per Stirling Capital Management, LLC, DBA Per Stirling Private Wealth and B. B. Graham & Co., Inc., are separate and otherwise unrelated companies.
This material represents an assessment of the market and economic environment at a specific point in time and is not intended to be a forecast of future events, or a guarantee of future results. Forward-looking statements are subject to certain risks and uncertainties. Actual results, performance, or achievements may differ materially from those expressed or implied. Information is based on data gathered from what we believe are reliable sources. It is not guaranteed as to accuracy, does not purport to be complete and is not intended to be used as a primary basis for investment decisions. It should also not be construed as advice meeting the particular investment needs of any investor.
Nothing contained herein is to be considered a solicitation, research material, an investment recommendation or advice of any kind. The information contained herein may contain information that is subject to change without notice. Any investments or strategies referenced herein do not take into account the investment objectives, financial situation or particular needs of any specific person. Product suitability must be independently determined for each individual investor.
This document may contain forward-looking statements based on Per Stirling Capital Management, LLC’s (hereafter PSCM) expectations and projections about the methods by which it expects to invest. Those statements are sometimes indicated by words such as “expects,” “believes,” “will” and similar expressions. In addition, any statements that refer to expectations, projections or characterizations of future events or circumstances, including any underlying assumptions, are forward-looking statements. Such statements are not guarantying future performance and are subject to certain risks, uncertainties and assumptions that are difficult to predict. Therefore, actual returns could differ materially and adversely from those expressed or implied in any forward-looking statements as a result of various factors. The views and opinions expressed in this article are those of the authors and do not necessarily reflect the views of PSCM’s Investment Advisor Representatives.
Neither asset allocation nor diversification guarantee a profit or protect against a loss in a declining market. They are methods that can be used to help manage investment risk.
Past performance is no guarantee of future results. The investment return and principal value of an investment will fluctuate so that an investor’s shares, when redeemed, may be worth more or less than their original cost. Current performance may be lower or higher than the performance quoted.
Definitions
The Standard & Poor’s 500 (S&P 500) is a market-capitalization-weighted index of the 500 largest publicly-traded companies in the U.S with each stock’s weight in the index proportionate to its market. It is not an exact list of the top 500 U.S. companies by market capitalization because there are other criteria to be included in the index.
The Russell 1000 Index measures the performance of the largest 1000 U.S. companies representing approximately 90% of the investable U.S. equity market.
The Russell 2000 Index measures the performance of approximately 2,000 small-cap companies in the Russell 3000 Index, which is made up of 3,000 of the biggest U.S. stocks. The Russell 2000 serves as a benchmark for small-cap stocks in the United States.
The Nasdaq Composite index tracks the performance of about 3,000 stocks traded on the Nasdaq exchange. It’s mainly used as an indicator of how well companies in the tech sector – both large and small – are doing.
The Bloomberg Magnificent 7 Index is an equal-dollar weighted equity benchmark consisting of a fixed basket of 7 companies classified in the United States and representing the Communications, Consumer Discretionary and Technology sectors as defined by the Bloomberg Industry Classification System (BICS).
The Standard & Poor’s MidCap 400 Index provides investors with a benchmark for mid-sized companies. The index, which is distinct from the LargeCap S&P 500®, is designed to measure the performance of 400 mid-sized companies, reflecting the distinctive risk and return characteristics of this market segment.
The Standard & Poor’s SmallCap 600 Index seeks to measure the small-cap segment of the U.S. equity market. The index is designed to track companies that meet specific inclusion criteria to ensure that they are liquid and financially viable.
Citations
-
“The Year In The Markets; 1999 Extraordinary Winners and Losers”, Floyd Norris, Posted 1/3/2000, https://www.nytimes.com/2000/01/03/business/the-year-in-the-markets-1999-extraordinary-winners-and-more-losers.html#:~:text=The%20story%20of%20the%20stock,by%20thousands%20of%20percentage%20points.
-
“Bespoke Stat Sheet”, Bespoke Investment Group, Posted 2/9/2024
-
“Indices 2024 outlook: Equity”, Mike Pruzinsky, Posted 2/1/2024, https://www.bloomberg.com/professional/blog/indices-2024-outlook-equity/
-
“Digging into the big tech rally”, Jonathan Linden, Elyse Ausenbaught, Matthew Landon, Posted 2/9/2024, https://www.jpmorgan.com/insights/outlook/market-outlook/tmt-digging-into-the-big-tech-rally
-
“Bespoke Stat Sheet”, Bespoke Investment Group, Posted 2/9/2024
-
“Bespoke Stat Sheet”, Bespoke Investment Group, Posted 2/9/2024
-
“Quick Comments/What We’re Reading”, Alex Malitas, Posted 2/16/2024, https://www.biancoresearch.com/visitor-home/
-
“Tech stocks aren’t at bubble levels”, Heather Long, Posted 3/10/2015, https://money.cnn.com/2015/03/10/investing/nasdaq-5000-stocks-market/index.html
-
“Magnificent 7 Earnings Results Solidify Market Leadership”, Sheraz Mian, Posted 2/2/2024, https://www.zacks.com/commentary/2220609/magnificent-7-earnings-results-solidify-market-leadership
-
“Digging into the big tech rally”, Jonathan Linden, Elyse Ausenbaught, Matthew Landon, Posted 2/9/2024, https://www.jpmorgan.com/insights/outlook/market-outlook/tmt-digging-into-the-big-tech-rally
-
“Digging into the big tech rally”, Jonathan Linden, Elyse Ausenbaught, Matthew Landon, Posted 2/9/2024, https://www.jpmorgan.com/insights/outlook/market-outlook/tmt-digging-into-the-big-tech-rally