31
MayPer Stirling Capital Outlook – May
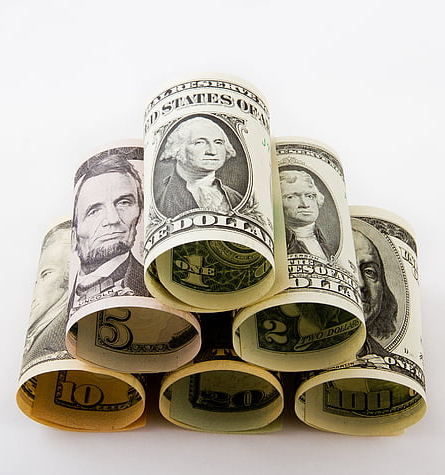
There is an old expression that “keeping your money in cash guarantees your ability to grow poor safely”. That is not to suggest that people should not keep enough money in cash or cash-like alternatives, including bank savings accounts, mutual fund money markets, T-bills, and C.D.s, to pay for all short and many intermediate-term needs, plus an emergency fund. Most people absolutely should.
There are also times, from a more tactical perspective, when it makes sense to keep a disproportionately large percentage of one’s savings in cash and cash equivalents, either in the name of capital preservation during periods of market turmoil, or because yields are sufficiently attractive to make cash a compelling option from a risk-adjusted return perspective. We would argue that this second scenario almost perfectly describes the environment of the past two years or so.
With yields of around 5% available through both mutual fund money markets and T-bills, the past two years have been an unusually attractive time during which to keep a relatively high percentage of one’s longer-term money in cash. For perspective, a 5% yield provides approximately 44% of the 11.35% per year total return averaged by the S&P 500 over the past fifty years (with dividends reinvested), but without the risk of market-related losses.1
As James Grant, publisher of Grant’s Interest Rate Observer recently quipped “it’s nice to have an interest rate to observe again”.

Savers can thank the Federal Reserve, whose aggressive, albeit belated, monetary policy response to the surge in inflation drove short-term interest rates (the Fed Funds Rate [above]) from near 0% to over 5% in only about a year and a half. By doing so, they helped to create one of the most attractive environments for holding cash in recent memory, particularly with inflation declining sharply over most of the period.
Such an attractive investment opportunity, at least from a risk-adjusted-return perspective, motivated an exodus of money from bank-related savings accounts, which continue to pay well below market rates, to T-bills and mutual fund money markets. It is hardly a surprise when you consider that a 5% yield is 735% higher than today’s average bank money market yield of only 0.68%.2
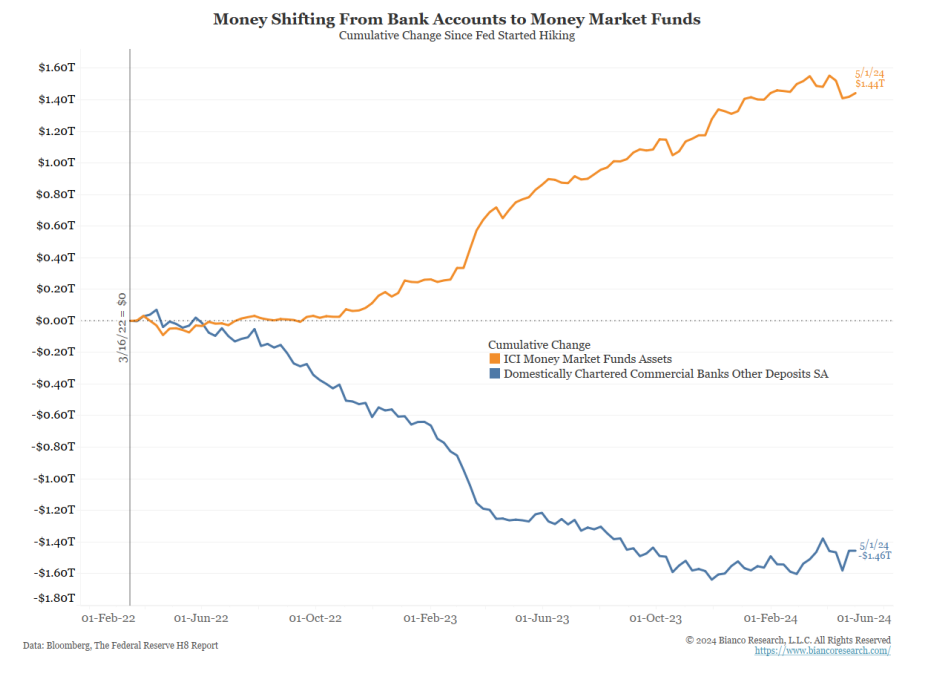
As illustrated by the previous chart of the Fed Funds Rate, such opportunities have been rare over recent decades. Indeed, for the first time since the pandemic, savers and investors have had an opportunity to make a reasonable return on their money without necessarily needing to put their principal at any risk.
Of course, the problem with storing one’s longer-term savings and/or investments in cash has rarely been that it will decline in nominal value, but instead that it will decline in purchasing power.
This is illustrated very clearly in the chart below, which shows the average rate paid on short-term certificates of deposit (CDs) in red (which we are using as a proxy for the interest rates paid on cash), and inflation (the Consumer Price Index [CPI]) in blue. As you can see, from the 1970s until the late 1990s, it was not unusual to see the interest rates paid on cash to be higher than the inflation rate, which is important if one is to maintain the purchasing power of their money (how much it will actually buy on an after-inflation basis).
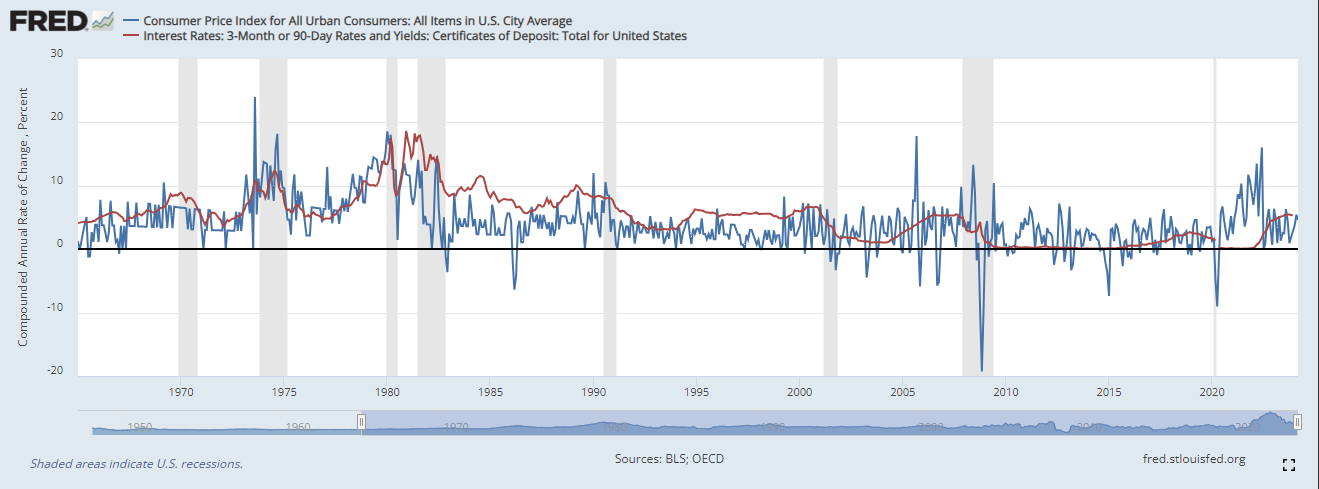
However, if you look at the history since the start of the new millennium, you will see that the rates paid on cash have only very rarely and quite briefly exceeded the inflation rate, which means that the purchasing power of savers and holders of cash has steadily eroded for almost a quarter century.
Further complicating matters is the impact of taxes. Using even the current relatively high interest rate environment as an example, a 5% yield reduced by a 30% income tax leaves an after-tax yield of 3.5%, which is roughly equivalent to the current 3.4% inflation rate (CPI). As such, even at today’s interest rates, savers are barely maintaining the purchasing power of their money, net of inflation and taxes. So, what happens when rates decline?
This is where “opportunity cost” is also likely to enter into the equation, as the Federal Reserve has made it abundantly clear that, in their estimation, the next move in short-term interest rates will almost certainly be lower.
In such an environment, we think that there are two very timely questions that holders of significant cash should be asking themselves:
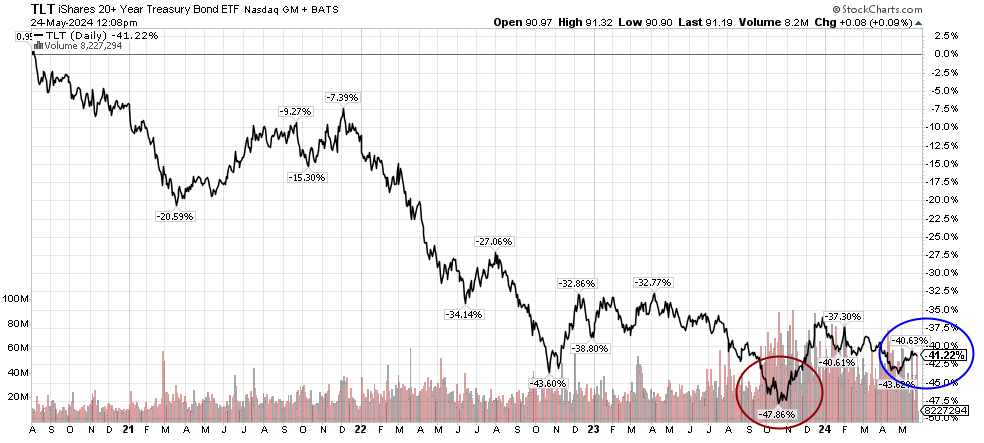
First of all, are there other, more attractive uses for one’s money, particularly when you consider that the Fed-driven surge in interest rates has catalyzed an almost four-year-old bear market in bonds, and that some portions of the bond market, particularly high-quality, longer-term debt like Treasury Bonds have lost more than 40% of their value since the summer of 2020. To quote another pithy comment from James Grant, bonds went from “providing risk-free return to return-free risk”.
We are not necessarily advocating investment into long-term Treasuries but are instead highlighting the severity of the recent decline, and the fact that extraordinary declines often create investment opportunities worthy of one’s consideration.
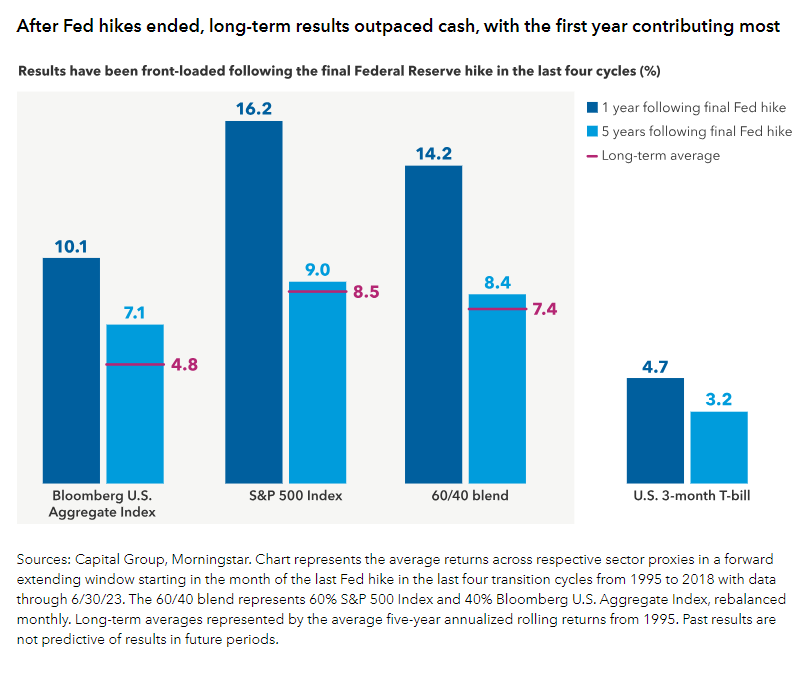
We agree with the broadly expected assumption that the Fed’s July 2023 rate hike was the last rate hike of this cycle. If that premise proves correct, it makes this chart of the aftermath of the last four rate-hiking cycles potentially quite telling, as it shows that, in the one and three years post the last Fed rate hike, stocks and bonds both performed better than their historic averages, in addition to strongly outperforming three-month T-bills, which also serve as a viable proxy for deposit rates on cash. Obviously, the past is not necessarily prologue.
If nothing else, history suggests that the sizable decline in bonds has changed quite considerably the risk-adjusted return potential of the debt and credit markets by boosting yields and improving a phenomenon called “convexity”, which we will address below.
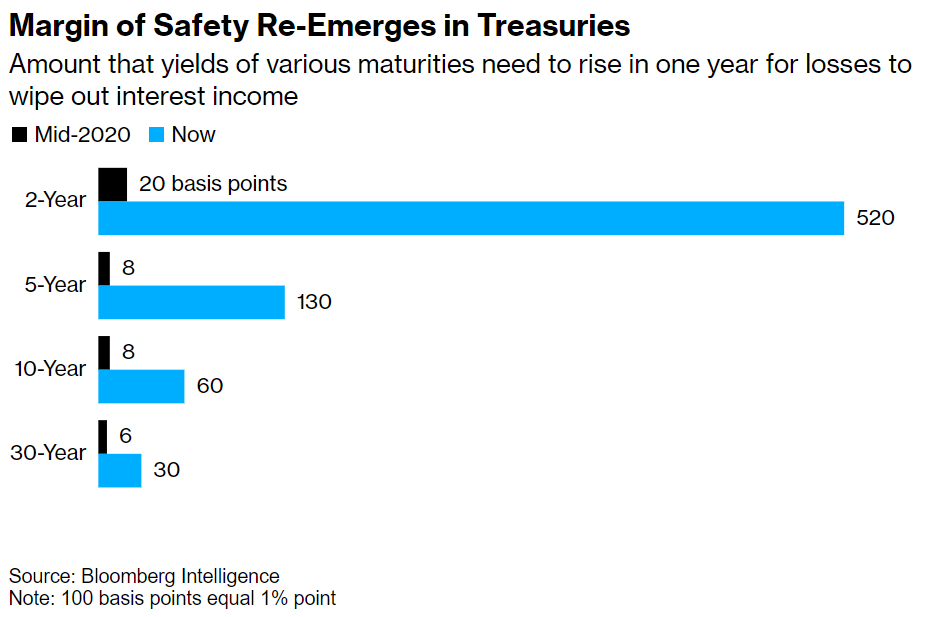
However, let us start with how today’s higher yields provide at least a partial “safety net” for bond prices, as they are now high enough that it would take a fairly substantial increase in interest rates to generate a negative total return in a bond.
The above “Margin of Safety” chart does an excellent job of illustrating this phenomenon. As a point of reference, yields were so low back in mid-2020 that even a de minimis increase in interest rates (black bar) would have generated a capital loss more than sufficient to offset the positive yield and produce a negative total return.
In sharp contrast, current yields are high enough that it would take a quite substantial increase in interest rates (blue line) before the resulting capital loss would be sufficient to offset the yield and produce a negative total return. In the case of 2-year and 5-year Treasuries, as examples, it would take a large (and we believe highly unlikely) increase in interest rates of between 5.2% and 1.3% respectively to produce a negative total return.
Remember that there is an inverse relationship between interest rates and bond prices, such that prices fall as rates rise and vice versa. This relationship stands at the core of some of the shortcomings of cash as a long-term holding, including “opportunity cost”.
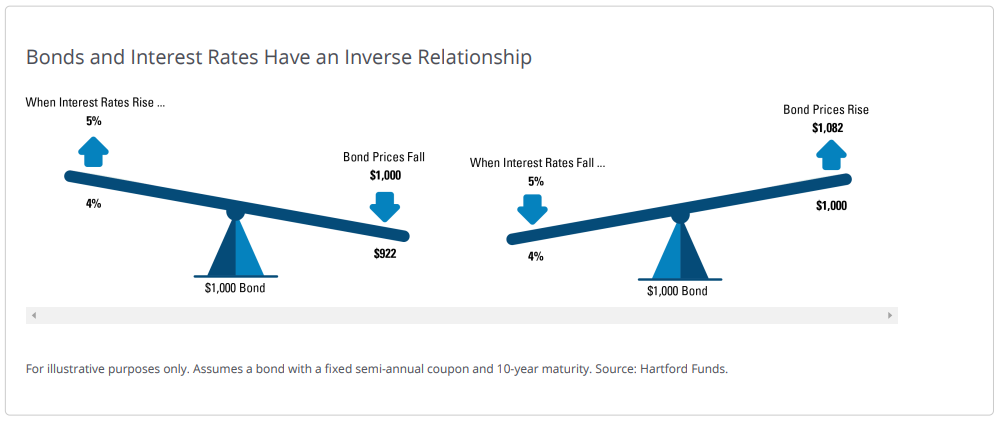
Specifically, unlike intermediate and longer-term notes and bonds that appreciate in value when interest rates fall, cash vehicles provide no ability to profit as rates in the economy decline. To the contrary, cash and cash equivalents face “reinvestment risk” in a falling rate environment, as the yields earned will, by definition, follow rates lower as they decline.
And then there is the matter of convexity, which is a mathematical measure of the interest rate sensitivity of different maturities of debt at different yield levels. It helps to quantify the upside potential and downside risk associated with different maturities of debt. At currently available yields, that relationship is very lop-sided in the favor of income investors.
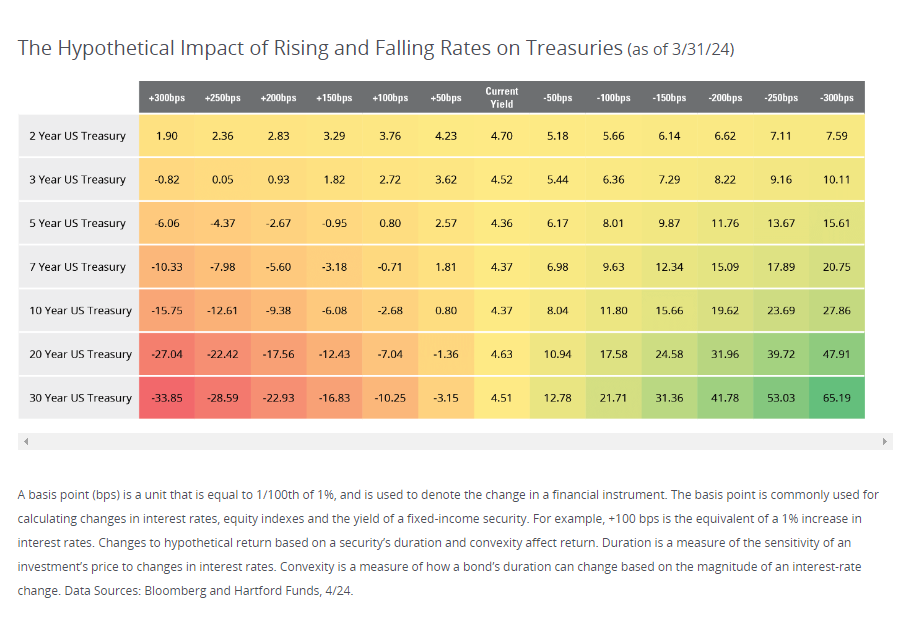
For example, if interest rates climb by 1%, a 2-year Treasury bill would still have a positive 1-year total return of 3.76% whereas, if rates fell by 1%, a 2-year Treasury would post a positive 1-year total return of 5.66%. Similarly, if interest rates climbed by 1.0%, a 10-year Treasury note would suffer a 1-year loss of -2.68% whereas, if rates fell by 1%, a 10-year Treasury would post a positive 1-year total return of 11.80%. In each instance, the upside potential for prices in response to any given drop in rates is notably higher than the downside risk to prices associated with an equal increase in rates. In short, at current yields, the risk-adjusted-return potential of bonds and notes, all other things being equal, is slanted significantly in the favor of income investors.
We had suggested above that there is a second important question that cash-heavy investors/savers should be asking themselves, which is, assuming there are more attractive opportunities than remaining in cash in a declining interest rate environment, should one consider a move to other alternatives now, or wait for rates to actually start their decline?
History suggests that, because markets are forward-looking by nature, if you wait for the Fed to actually start cutting rates, you will have in all likelihood already missed much of the potential returns.
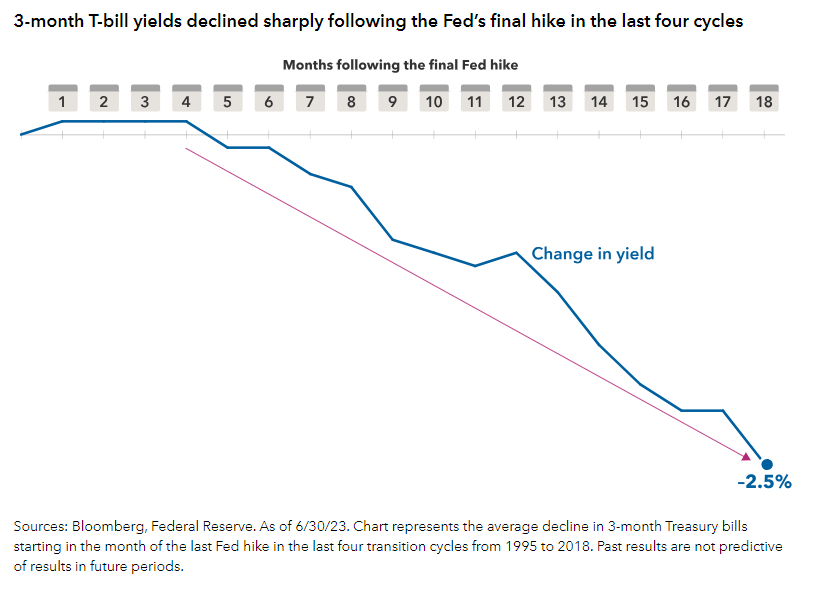
Indeed, according to Capital Group, “history shows that in the 18 months after the Fed ended hikes in the last four cycles, yields on cash-like investments have traditionally decayed rapidly. The 3-month Treasury yield, a benchmark Treasury security with a yield similar to cash-like investments, fell an average of 2.5%”.3
While history is an imperfect guide, it should be noted that the presumptive last rate hike already took place about ten months ago.
You can see this rapid decline in yields (i.e., increase in prices) reflected in the below chart of three-month T-bill yields.
While we remain rather skeptical that we will see such a large decline in yields this cycle, the above convexity chart does show that a 2.5% drop in yields across all maturities (i.e., across the yield curve) would produce gains in the Treasury market of between 7.59% and 65.19%, depending on duration.
It is worth noting that the stock market also tends to benefit when rates fall, as lower rates increase the willingness of investors to pay higher multiples for equities relative to their earnings (i.e., it causes “multiples expansion”).
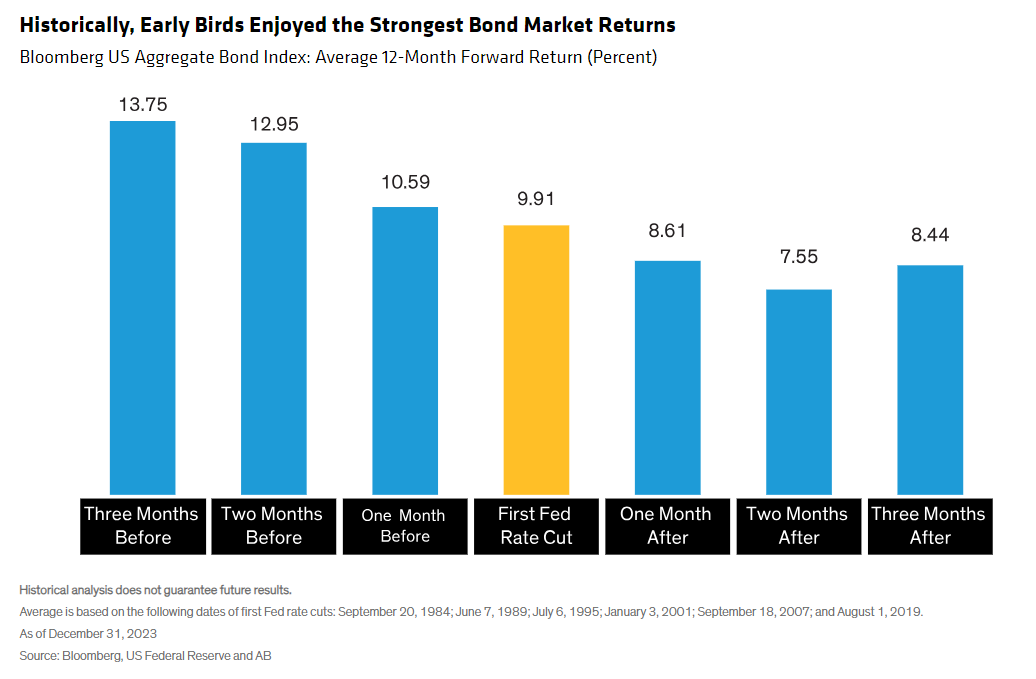
Indeed, history suggests that there is a notable cost associated with waiting too long to diversify out of cash. As you can see from the chart below, the largest 1-year forward bond market returns were enjoyed by those proactive investors who transitioned from cash to bonds, bills, and notes before the Fed actually started cutting rates (the yellow bar below).
PIMCO summarized the current environment quite well in a recent report in which they stated, “historically, cash has almost never outperformed bonds at this stage of the cycle, with policy rates at peak levels and the Federal Reserve poised to cut. Only in 1981 did bond investors have to wait a little more than a year from the initial rate cut to outperform cash.
In all other cycles dating back to 1980, it took a year or less for bonds to outperform cash. And not by a little. On average, core plus bond portfolios (or short and intermediate maturities) outperformed cash (as gauged by 3-month T-bills) by about five percentage points over the year following the peak in the federal funds rate, and by about 4.5 percentage points annualized over the ensuing three years.”4
While Fed Chairman Powell recently reinforced his guidance that the markets should expect rate cuts to be delayed, which may keep “cash” in good standing for a while longer, it is, at the very least, time to start pondering the answers to those two important questions.
Disclosures
Advisory services offered through Per Stirling Capital Management, LLC. Securities offered through B. B. Graham & Co., Inc., member FINRA/SIPC. Per Stirling Capital Management, LLC, DBA Per Stirling Private Wealth and B. B. Graham & Co., Inc., are separate and otherwise unrelated companies.
This material represents an assessment of the market and economic environment at a specific point in time and is not intended to be a forecast of future events, or a guarantee of future results. Forward-looking statements are subject to certain risks and uncertainties. Actual results, performance, or achievements may differ materially from those expressed or implied. Information is based on data gathered from what we believe are reliable sources. It is not guaranteed as to accuracy, does not purport to be complete and is not intended to be used as a primary basis for investment decisions. It should also not be construed as advice meeting the particular investment needs of any investor.
Nothing contained herein is to be considered a solicitation, research material, an investment recommendation or advice of any kind. The information contained herein may contain information that is subject to change without notice. Any investments or strategies referenced herein do not take into account the investment objectives, financial situation or particular needs of any specific person. Product suitability must be independently determined for each individual investor.
This document may contain forward-looking statements based on Per Stirling Capital Management, LLC’s (hereafter PSCM) expectations and projections about the methods by which it expects to invest. Those statements are sometimes indicated by words such as “expects,” “believes,” “will” and similar expressions. In addition, any statements that refer to expectations, projections or characterizations of future events or circumstances, including any underlying assumptions, are forward-looking statements. Such statements are not guarantying future performance and are subject to certain risks, uncertainties and assumptions that are difficult to predict. Therefore, actual returns could differ materially and adversely from those expressed or implied in any forward-looking statements as a result of various factors. The views and opinions expressed in this article are those of the authors and do not necessarily reflect the views of PSCM’s Investment Advisor Representatives.
Neither asset allocation nor diversification guarantee a profit or protect against a loss in a declining market. They are methods that can be used to help manage investment risk.
Past performance is no guarantee of future results. The investment return and principal value of an investment will fluctuate so that an investor’s shares, when redeemed, may be worth more or less than their original cost. Current performance may be lower or higher than the performance quoted.
Definitions
The Standard & Poor’s 500 (S&P 500) is a market-capitalization-weighted index of the 500 largest publicly-traded companies in the U.S with each stock’s weight in the index proportionate to its market. It is not an exact list of the top 500 U.S. companies by market capitalization because there are other criteria to be included in the index.
The Bloomberg Barclays US Aggregate Bond Index measures the investment grade, US dollar-denominated, fixed-rate taxable bond market. The index includes Treasuries, government-related and corporate securities, MBS (agency fixed-rate pass-throughs), ABS and CMBS (agency and non-agency).
The Consumer Price Index (CPI), which is produced by the Bureau of Labor Statistics, is a measure of the average change over time in the prices paid by urban consumers for a market basket of consumer goods and services. Indexes are available for the U.S. and various geographic areas. Average price data for select utility, automotive fuel, and food items are also available.
Citations
-
“S&P 500 Historical Return Calculator [With Dividends]”, Nick Maggiulli, As of 5/29/2024, https://ofdollarsanddata.com/sp500-calculator/
-
“Average Money Market Rates: Maximizing Your Savings Potential”, Liz Knueven, Sophia Acevedo, Sarah Sibert, Posted 5/21/2024, https://www.businessinsider.com/personal-finance/average-money-market-interest-rate#:~:text=How%20money%20market%20rates%20work,your%20bank%20if%20this%20happens
-
“As rate hikes near end, historic investor opportunity may begin”, Mike Gitlin, Posted 9/15/2023, https://www.capitalgroup.com/individual-investors/is/en/insights/articles/rate-hikes-near-end-historic-investor-opportunity-may-begin.html
-
“The Cost of Cash: A $6 Trillion Question”, Marc P. Seidner, Pramol Dhawan, Posted 5/7/2024, https://www.pimco.com/en-us/insights/economic-and-market-commentary/pimco-perspectives/the-cost-of-cash-a-6-trillion-question/