29
JulyPer Stirling Capital Outlook – July
“While such narrow markets can persist for extended periods, there are times (perhaps like the present) when the extent of both the poor market breadth and the vast outperformance of the leading stocks reach potentially unsustainable extremes…we suspect that it will result in some significant change in the markets, whether it be a change in leadership, a broadening out of the market beyond today’s very narrow leadership (hopefully), a reversal in market trend, or something else entirely.”
-June 27, 2024, Per Stirling Capital Outlook
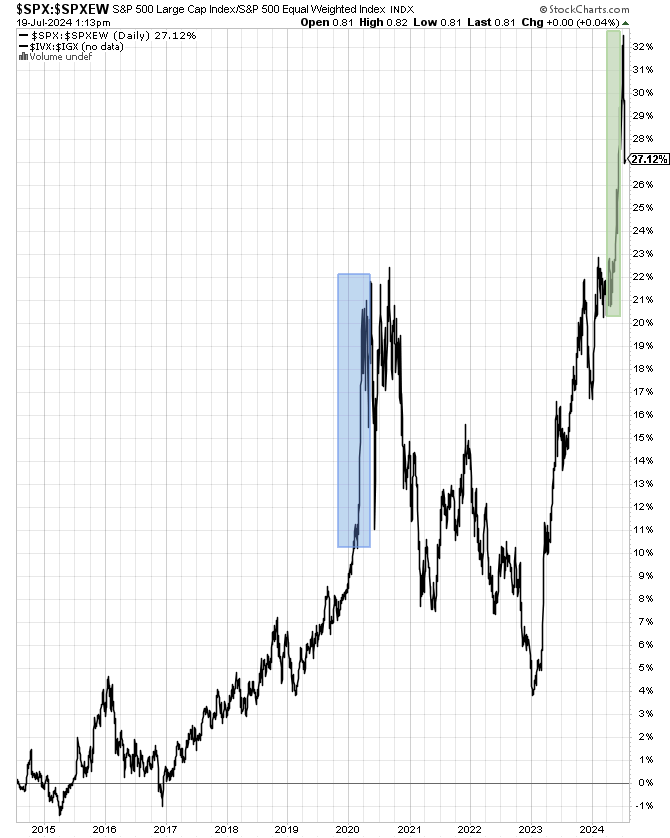
In this past June’s commentary, we used a ratio chart of the S&P 500 Index to illustrate that market breadth (the number of stocks actually participating in the market’s advance) had reached low levels not seen since the market’s emergence from the 2020 pandemic-related bear market.
As described in that report, “this ratio chart (see the above)…divides the capitalization-weighted S&P 500 (where the most valuable companies have the greatest influence on the performance of the index) by the equal-weighted S&P 500 (which includes the same 500 companies, but where each of them has an equal influence on the performance of the index). When the price-line is rising, the biggest, most valuable stocks are outperforming and, the steeper the line, the more extreme the level of outperformance.”
At the time, we also noted our concern that such a narrow market, with the “generals” advancing but the “troops” lagging behind, was potentially unsustainable and likely to result in the aforementioned “significant change in the markets”.
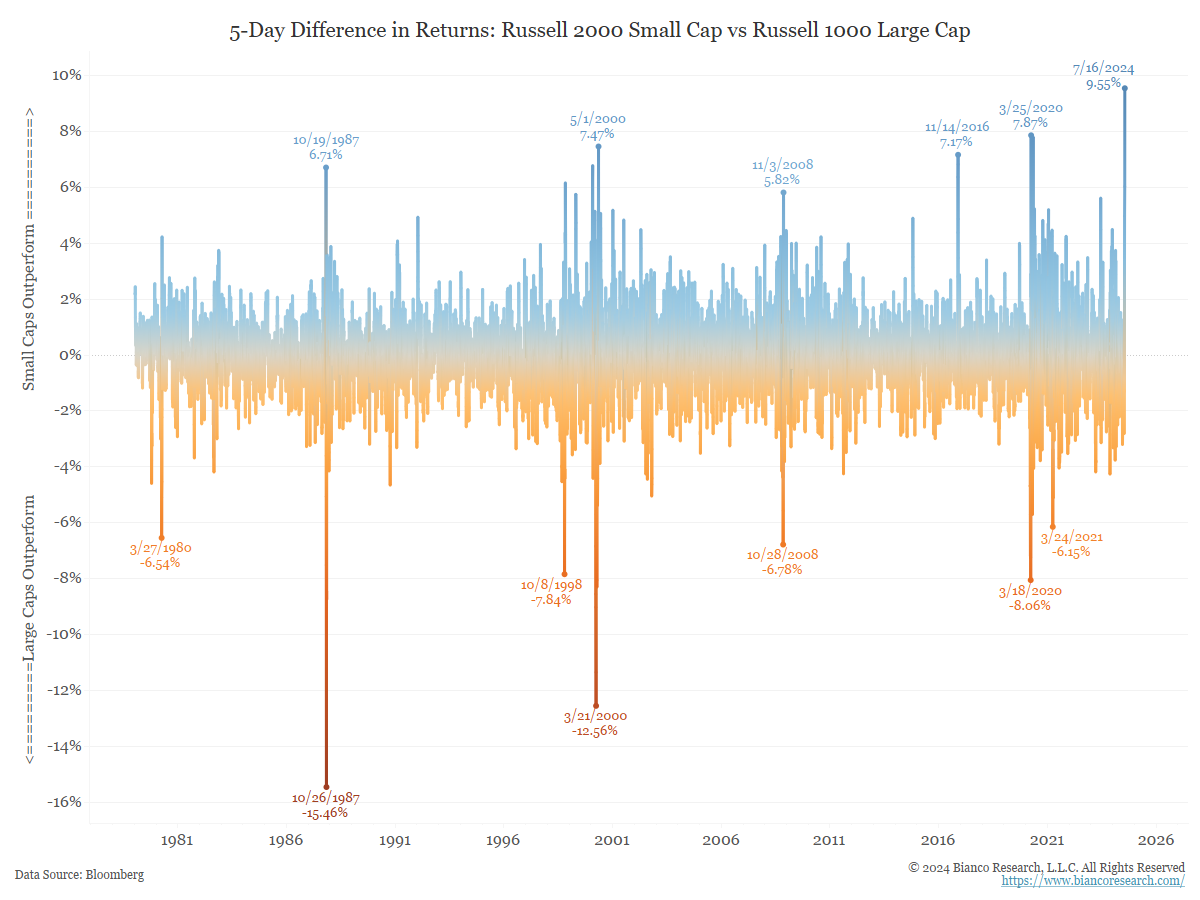
That part of our premise has clearly proven out, at least for the time being, as, after years of underperformance, smaller stocks have just outperformed larger stocks over a five-day period by the most (9.5%) in almost 50 years (we suspect largely due to short-covering).
The same can be said of value stocks suddenly and significantly outpacing growth and momentum stocks, and most non-technology sectors finally outperforming the technology sector, after years of relative underperformance.
The below chart1 shows the Russell 1000 Growth Index divided by the Russell 1000 Value Index and the overall Russell 1000 Index of America’s 1000 largest public companies divided by the Russell 2000 Index of smaller companies. These ratio charts illustrate both the abrupt reversal from growth stock to value stock outperformance and that of large stock outperformance to small stock outperformance. The pivot point for both was the July 8th release of the June Consumer Price Index (CPI).
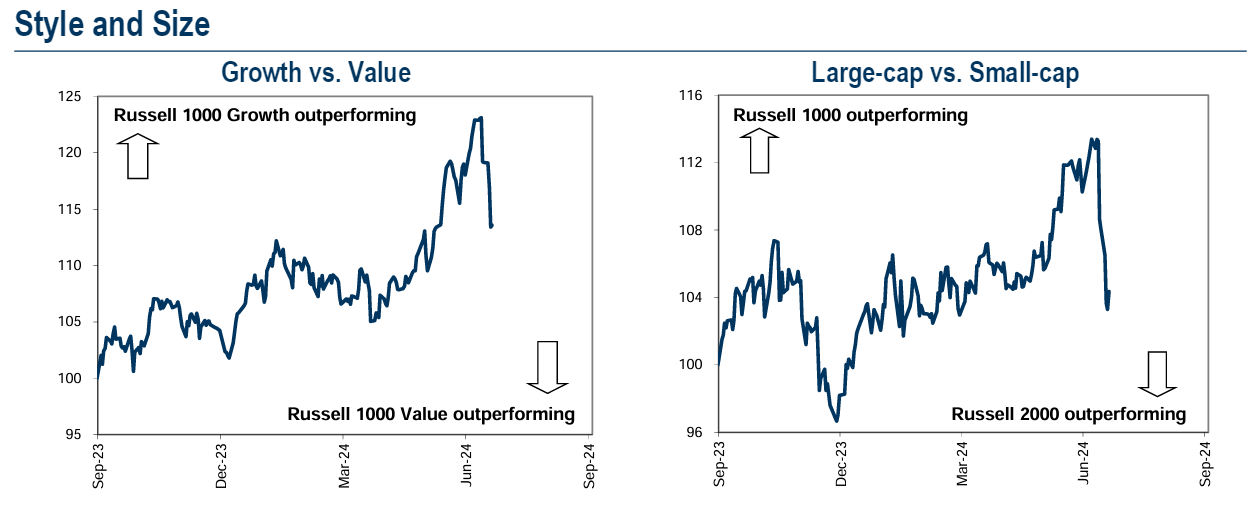
That said, while the CPI data pretty clearly “lit the fuse”, we believe that there were several other significant catalysts underlying this shift, starting with the unsustainable nature of the historically narrow market breadth and the growing probability of the Fed not only lowering rates, but lowering them both sooner and more aggressively than investors had expected as recently as a couple of weeks ago, due to the recent improvements in inflation data.
Interest rates impact different sectors of the market differently, which is why the prospects for an unexpectedly dovish Fed caused investors to reevaluate their expectations for market leadership.
Indeed, we believe that one of the major reasons for the past several years of dominance by mega-cap technology stocks is that they proved largely immune to the impact of higher interest rates. Arguably, since these huge companies were not significantly hampered by rates going up, they are also unlikely to benefit markedly by rates going down.
In contrast, a lowering of rates has historically proven highly beneficial for smaller companies, which tend to both carry a heavier debt burden and are normally required to pay higher rates than their larger brethren, and value-oriented and dividend paying stocks, which tend to be very sensitive to both interest rates and the strength of the economy.
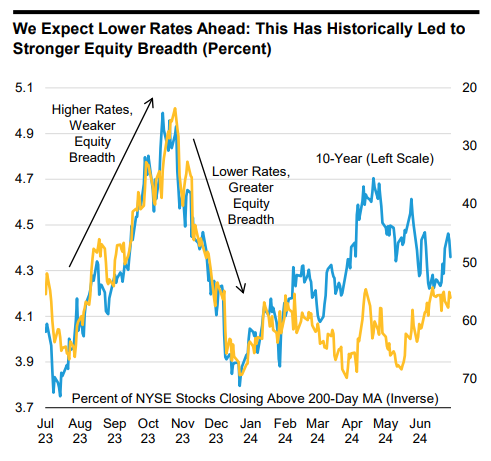
Indeed, as is illustrated in the above chart from Alliance Capital2, which compares the 10-year Treasury yield in blue with an inverted chart of the percentage of New York Stock Exchange stocks trading above their average price of the past 200 days in gold, higher interest rates tend to be associated with poor market breadth, while breadth has historically improved (i.e., more stocks have participated in the bull market), when interest rates are low or trending downward.
This correlation between interest rates and stock prices has traditionally been particularly powerful in regard to smaller stocks which, as is illustrated below, have historically substantially outperformed mid- and larger-capitalization stocks in the three-, six-, and twelve-month periods after the first rate cut of the cycle by the Federal Reserve.
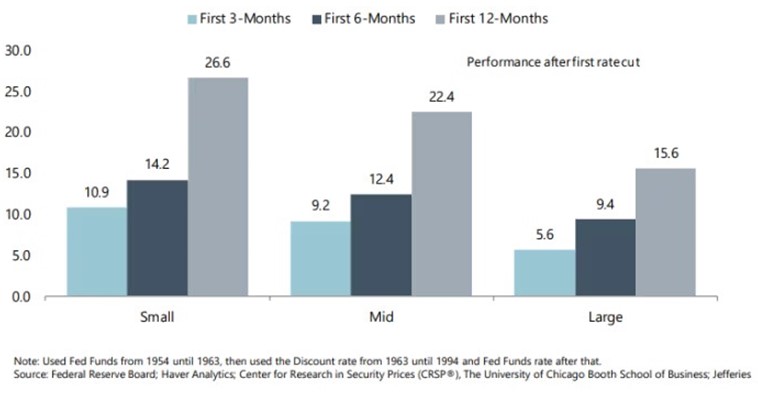
Obviously, there is no guarantee that either of these two tendencies will be repeated in the future.
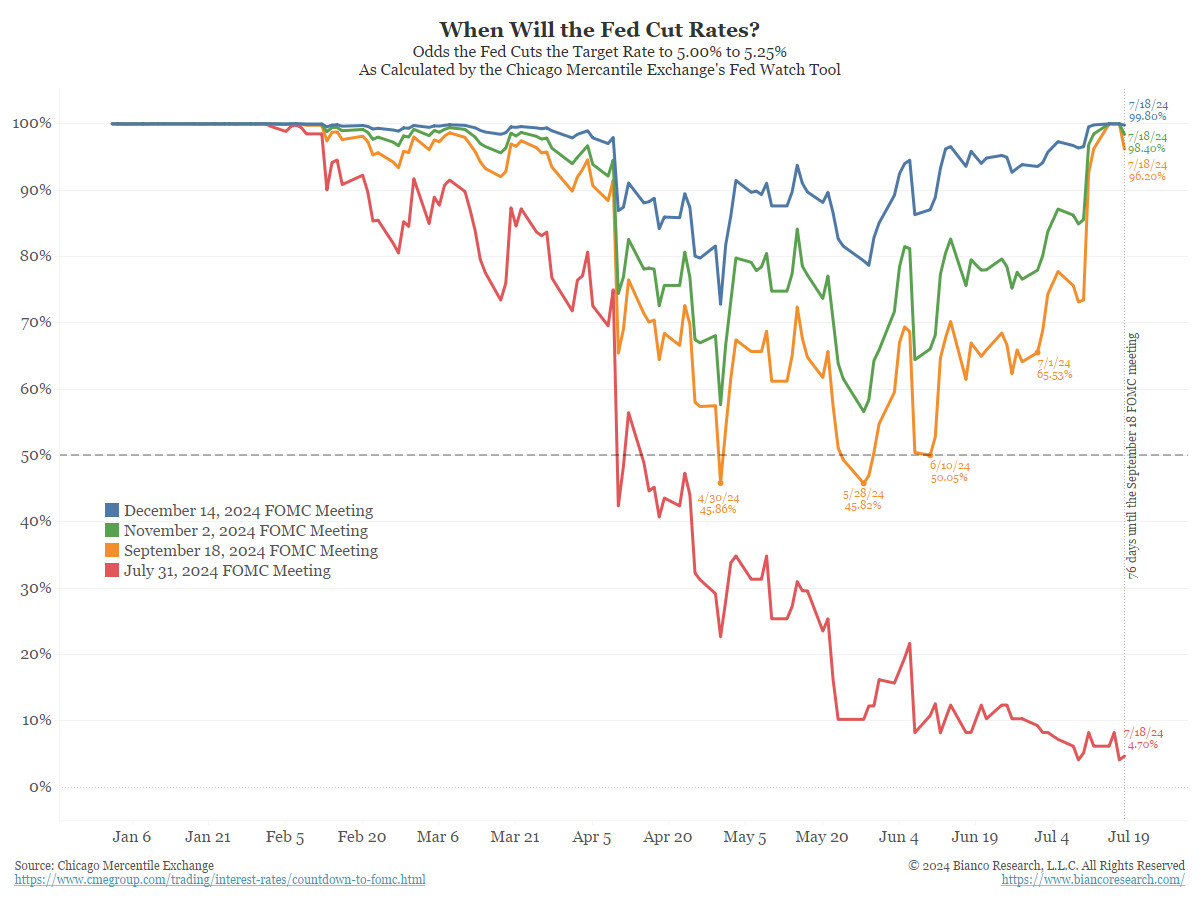
Of note, while the Fed Funds futures markets are a far cry from being a perfect indicator of future monetary policy, they are currently reflecting a very strong consensus opinion (assigning a greater than 90% probability) that the Fed will respond to the recent improvements in the inflation data by implementing the first rate cut of this cycle at the September 18th meeting of the Fed’s Open Market Committee.
Equity investors responded to the dovish shift in monetary policy expectations with a historic, albeit only week-long, explosion higher in the price of smaller company stocks, and a notable but similarly brief change in investor preferences from growth stocks to more value-oriented (i.e., less highly valued) stocks.
However, that shift proved to be, at least temporarily, unsustainable, and stocks of almost all capitalizations and sectors seem to finally be succumbing to some arguably much-needed profit-taking. Indeed, as of July 16th, the S&P 500 had gone 350 trading days without a single 2% drop. That is the longest streak since 2007.3 As the old expression goes, “trees don’t grow to the sky”, which simply means risk markets need occasional corrective phases to keep investors from becoming too complacent and markets from becoming too speculative.
From our perspective, this seems like a quite appropriate time for the bull market to take a rest, as the change in interest rate expectations, while presumably bullish for equities over the intermediate and longer term, created quite a bit of uncertainty in the near term. Investors went from feeling very confident about market leadership and trends to an unsettled market environment, where they can only speculate about what the trend will be and where the leadership will be found.
It is not unusual for investors to respond to such periods of uncertainty by pausing additional investment, which could help to explain the recent pullback.
It is also true that investors tend to “buy the rumor and sell the fact”. More specifically, investors have been driving equity markets sharply higher since they first started aggressively pricing-in lower interest rates in November of last year, and with a 90%+ probability of a September rate cut being implied by the futures markets, it is rather likely that a string of rate cuts is already largely priced into stocks and bonds, thus providing investors with a natural opportunity to do some selling and lock in some of their profits.
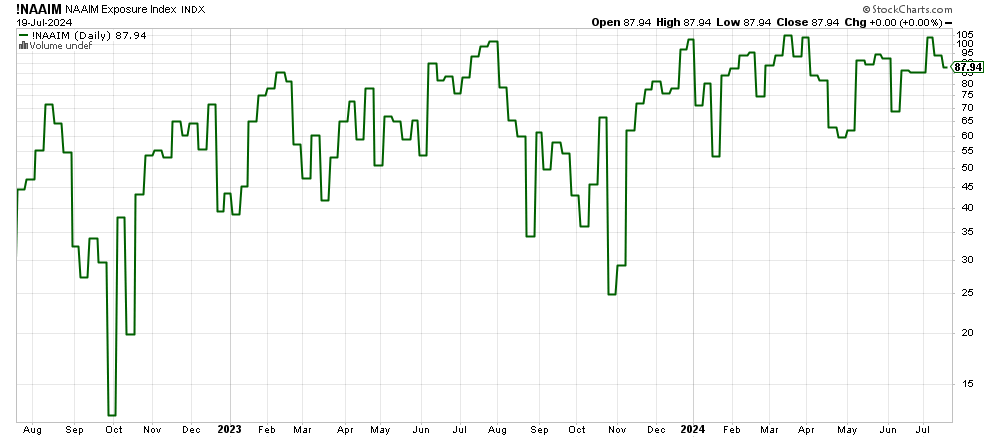
Moreover, because investors have enjoyed an extended period of relatively low volatility and rather exceptional equity market returns, investor sentiment had reached fairly ebullient levels. You can see this reflected in the above chart, which provides a reading of equity market exposure among more tactical investors and portfolio managers.
As of early July, the average equity market exposure among members of the American Association of Active Investment Managers had reached 105% of portfolio value (green line above), which suggests that active investors were, on average, already very aggressively allocated to equities.
While their average equity exposure has since dropped to just under 88%, it still reflects a much higher than average equity allocation for this group, which calls into question their current need to add substantially more equity exposure.
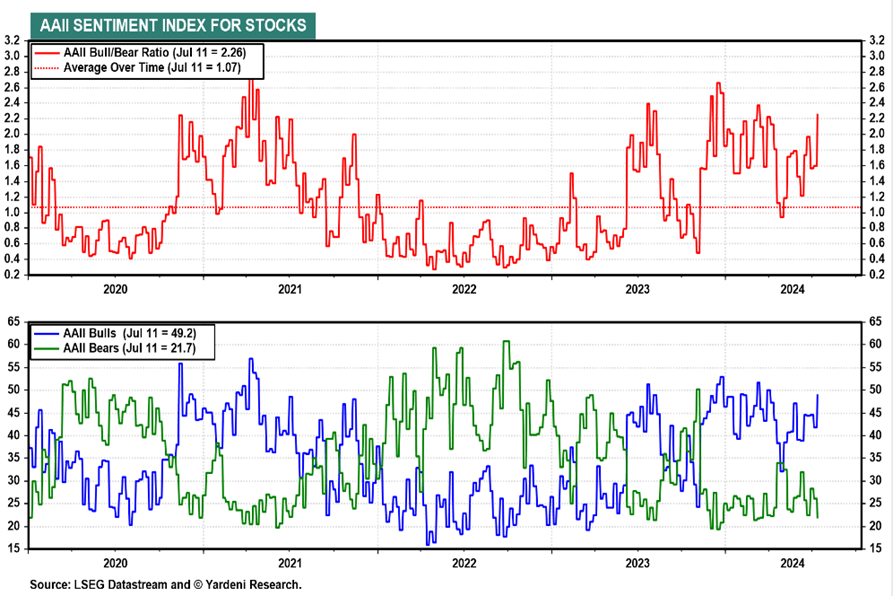
Many measures of investor sentiment further documented this overwhelmingly bullish mindset among investors. Of the total number of investors surveyed, bulls outnumbered the bears 49.2 to 21.7 or 2.26 bears per bull. Over twice the historic average of 1.07, according to the June 11th American Association of Individual Investors (AAII) Bull/Bear Survey. Such overwhelming bullishness often suggests that much of the money currently available for investment is already in the markets. If so, equity markets may need some time to consolidate their recent gains before making another run to the upside.
If that were not enough, over the past few weeks, political uncertainty has reached extreme levels, with an assassination attempt, the replacement of Biden at the top of the Democratic ticket, and a stark reminder of presidential favorite Trump’s ability to create chaos and uncertainty with an offhand comment, such as his recent statement that the U.S. might not defend Taiwan from Chinese aggression, which sent technology stocks into a tailspin due to the pivotal role that Taiwan plays in the semiconductor industry, the overall technology supply chain, and most modern economies across most of the globe.
While risk markets (and domestic equity markets in particular) have traditionally been rather politically indifferent, investors have historically despised uncertainty, and the current political environment is introducing an elevated level of uncertainty that investors have not witnessed since the Supreme Court stopped the presidential recount in Florida in 2000 and during the final weeks of Trump’s Presidency in late 2020 and early 2021. It will be fascinating to see how this plays out over the coming weeks.
When we originally wrote the June commentary quoted at the top of this report, we were fairly confident that the conditions existed for the markets to change in some substantial way. However, we had no particular insight into how that change would manifest itself. As we noted in that Outlook, “only time will tell how the anticipated change in market characteristics will evolve, or if the status quo simply continues”. It is a month later, and little has changed. The markets continue to offer fairly little in the way of additional clarity.
That said, while the past is not necessarily prologue, history may offer some useful guidance. For example, as illustrated in two of the charts included above, lower interest rates have historically benefitted small and mid-sized company stocks more than larger, “blue-chip” stocks, as smaller companies traditionally have higher debt burdens, more variable-rate debt, and higher borrowing costs and, as a result, they tend to derive the greatest benefit from falling interest rates.
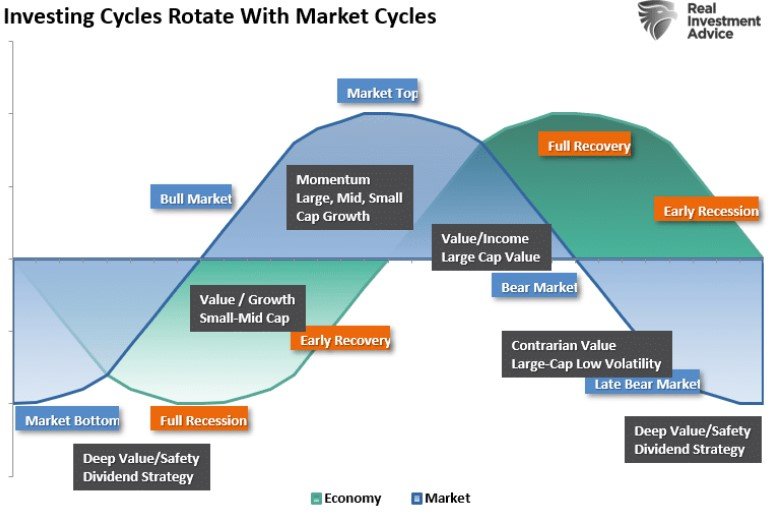
Even so, as illustrated in the above chart4, this is not the part of the economic cycle that tends to favor the stocks of smaller companies. Instead, they tend to outperform in the initial part of an economic recovery, after the economic low point has already passed.
During that stage, the economy is normally accelerating while interest rates are still falling, which tends to be economic nirvana for smaller companies. At this point, we expect smaller company stocks to perform better than they have in recent years, but not necessarily to adopt a longer-term leadership role.
We have a similar perspective on value stocks which, as illustrated above, also tend to perform best near the trough of economic cycles. As is the case with smaller companies, we believe that “value stocks” (energy, financials, basic materials, industrials and healthcare, etc.) will perform better than they have in recent years, but not necessarily outperform the mega-cap technology stocks that have powered the markets over recent history (at least, not on a longer-term basis).
Value stocks should also benefit from lower interest rates, albeit not to the same extent as smaller company stocks.
We do expect for value stocks to weather the anticipated economic slowdown better than the stocks of smaller companies, which makes us a little more inclined, when selecting from the previously unloved segments of the equity markets, to favor traditional value stocks over smaller and lower-quality stocks.
There are many reasons why mega-cap growth stocks (above) could fall out of favor. They are over-loved, over-owned, very expensive relative to current earnings, and have literally been market leaders since early in 2023. That said, they are also among America’s highest quality companies with massive, historically predictable revenues, strong balance sheets, high free cash flow, a growing tendency to pay dividends, and enormous share buyback programs.
While we absolutely recognize the possibility of an impending sector rotation, with investors selling these shares to move into other parts of the market, we are inclined, at least for the time being, to continue giving these mega-cap growth stocks the benefit of the doubt.
That said, when you consider that three of these stocks (Nvidia, Microsoft and Apple) each have a market capitalization greater than or equal to the combined value of the entire Russell 2000 Small Cap Index, you can see that even modest flows out of these huge stocks could provide an enormous boost to the share price of smaller companies.
We do believe that this partial rotation to smaller and value-oriented stocks will ultimately take place, and that the “soldiers” will ultimately join the “generals” in the advance. We just think that much of it will take place later in the economic cycle. In the meantime, our working premise is that the mega-cap stocks will successfully work through this short-term correction before resuming their leadership role.
Of course, there is another viable outcome being signaled by this “significant change in the markets”, and that is for the bull market as a whole to run out of steam due to its generally high valuations, excessive bullishness and perhaps even in anticipation of an impending recession or some geopolitical shock.
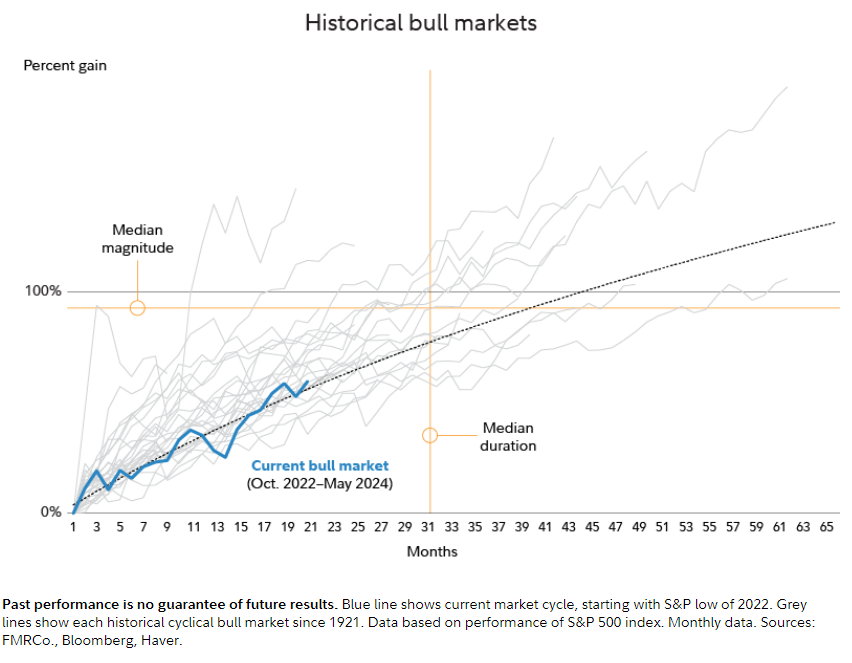
That said, we view this as a lesser possibility with the Fed apparently on the verge of rate cuts, with the economy still looking quite resilient, and with the current bull market, despite the impressive gains of the past two years, still underachieving the average bull market in terms of both duration and total return.
Meanwhile, we attribute much of the current spike in equity and bond market volatility to the recent surge in geopolitical uncertainty and a sudden loss of clarity regarding future market leadership, both of which should be resolved over time. All things considered; we believe that this bull market still has room to run.
Moreover, if lower interest rates do catalyze an improvement in market breadth, as history would suggest, it could finally allow investors to diversify their portfolios beyond the current narrow group of leaders, without necessarily needing to compromise the potential for attractive future returns.
Disclosures
Advisory services offered through Per Stirling Capital Management, LLC. Securities offered through B. B. Graham & Co., Inc., member FINRA/SIPC. Per Stirling Capital Management, LLC, DBA Per Stirling Private Wealth and B. B. Graham & Co., Inc., are separate and otherwise unrelated companies.
This material represents an assessment of the market and economic environment at a specific point in time and is not intended to be a forecast of future events, or a guarantee of future results. Forward-looking statements are subject to certain risks and uncertainties. Actual results, performance, or achievements may differ materially from those expressed or implied. Information is based on data gathered from what we believe are reliable sources. It is not guaranteed as to accuracy, does not purport to be complete and is not intended to be used as a primary basis for investment decisions. It should also not be construed as advice meeting the particular investment needs of any investor.
Nothing contained herein is to be considered a solicitation, research material, an investment recommendation or advice of any kind. The information contained herein may contain information that is subject to change without notice. Any investments or strategies referenced herein do not take into account the investment objectives, financial situation or particular needs of any specific person. Product suitability must be independently determined for each individual investor.
This document may contain forward-looking statements based on Per Stirling Capital Management, LLC’s (hereafter PSCM) expectations and projections about the methods by which it expects to invest. Those statements are sometimes indicated by words such as “expects,” “believes,” “will” and similar expressions. In addition, any statements that refer to expectations, projections or characterizations of future events or circumstances, including any underlying assumptions, are forward-looking statements. Such statements are not guarantying future performance and are subject to certain risks, uncertainties and assumptions that are difficult to predict. Therefore, actual returns could differ materially and adversely from those expressed or implied in any forward-looking statements as a result of various factors. The views and opinions expressed in this article are those of the authors and do not necessarily reflect the views of PSCM’s Investment Advisor Representatives.
Neither asset allocation nor diversification guarantee a profit or protect against a loss in a declining market. They are methods that can be used to help manage investment risk.
Rebalancing can entail transaction costs and tax consequences that should be considered when determining a rebalancing strategy.
Small capitalization securities involve greater issuer risk than larger capitalization securities, and the markets for such securities may be more volatile and less liquid. Specifically, small capitalization companies may be subject to more volatile market movements than securities of larger, more established companies, both because the securities typically are graded in lower volume and because the issuers typically are more subject to changes in earnings and prospects.
Past performance is no guarantee of future results. The investment return and principal value of an investment will fluctuate so that an investor’s shares, when redeemed, may be worth more or less than their original cost. Current performance may be lower or higher than the performance quoted.
Definitions
The Consumer Price Index (CPI), which is produced by the Bureau of Labor Statistics, is a measure of the average change over time in the prices paid by urban consumers for a market basket of consumer goods and services. Indexes are available for the U.S. and various geographic areas. Average price data for select utility, automotive fuel, and food items are also available.
The Standard & Poor’s 500 (S&P 500) is a market-capitalization-weighted index of the 500 largest publicly-traded companies in the U.S with each stock’s weight in the index proportionate to its market. It is not an exact list of the top 500 U.S. companies by market capitalization because there are other criteria to be included in the index.
The Russell 1000 Index measures the performance of the largest 1000 U.S. companies representing approximately 90% of the investable U.S. equity market.
The Russell 2000 Index measures the performance of approximately 2,000 small-cap companies in the Russell 3000 Index, which is made up of 3,000 of the biggest U.S. stocks. The Russell 2000 serves as a benchmark for small-cap stocks in the United States.
NAAIM Exposure Index represents the average exposure to US Equity markets reported by members of the National Association of Active Investment Managers.
Citations
-
“Weekly Research Briefing: Twister Time”, Blaine Rollins, Posted 7/23/2024, https://www.hamiltonlane.com/insight/weekly-research-briefing/twister-time?utm_source=wrb&utm_medium=e
-
“Capital Markets Outlook Distinguishing Signal from Noise”, AllianceBernstein, 7/23/2024, https://www.alliancebernstein.com/us/en-us/investments/insights/investment-insights/capital-markets-outlook-3q-2024-distinguishing-signal-from-noise.html
-
“Pressure Drop”, Steve Sosnick, Posted 7/16/2024, https://ibkrcampus.com/traders-insight/securities/stocks/pressure-drop/
-
“Small Cap Stocks May Be At Risk According To NFIB Data”, Lance Roberts, Posted 2/23/2024, https://realinvestmentadvice.com/small-cap-stocks-may-be-at-risk-according-to-nfib-data/