28
AugustPer Stirling Capital Outlook – August

Perfect Balance
Aristotle described it as the “Golden Mean”; Goldilocks described it as “not too hot and not too cold” and, if asked, the Federal Reserve would likely describe it as the perfect equilibrium between employment and inflation.
These two factors are arguably opposite sides of the same coin, as a strong economy is normally associated with both lower unemployment (a “good” thing), but also higher inflation and higher interest rates (usually a “bad” thing). By contrast, a weak economy is normally associated with higher unemployment (a “bad” thing), but also lower inflation and lower interest rates (normally a “good” thing).
Responsibility for maintaining the proper balance between these two factors was given to the Federal Reserve by Congress, who instructed them to pursue what is commonly referred to as the “dual mandate”. It directs the Fed to maximize employment while simultaneously maintaining price stability (a.k.a. maintaining sustainably low inflation).
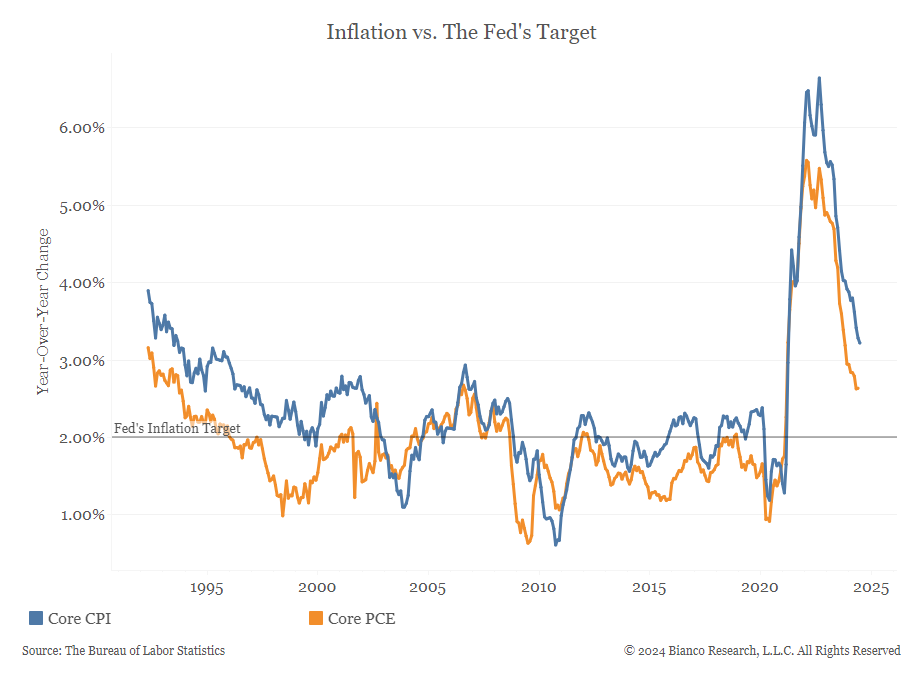
For much of the past twelve months, markets have progressively priced in such a “golden mean” result, where the Fed has presumptively engineered an optimal monetary policy balance that was sufficiently restrictive to reduce consumer inflation from 9% to 3%, while not being so restrictive that that it has caused a surge in unemployment or pushed the economy into recession.
Such a “soft landing” has historically been so difficult to achieve that many economists maintain that it has only been accomplished by the Federal Reserve once before, some thirty years ago, in 1994.
In an Outlook from February of 2023, we characterized successfully engineering a “soft landing” as “the monetary policy equivalent of landing a Boeing 747 on an aircraft carrier”. With the benefit of hindsight, Chairman Powell may have just pulled off the most impressive landing since Captain “Sully” Sullenberger’s emergency landing on the Hudson River back in January of 2009.
Expectations for this perceived soft landing increasingly feature a still-strong jobs market, falling interest rates, inflation returning towards the Fed’s 2% target, and the economy remaining robust. It is hard to imagine a more bullish confluence of factors for the equity markets, while being mildly constructive for most segments of the bond market. Most of the equity market has responded with strong year-to-date returns, while the prices of most bonds, bills and notes have basically meandered slightly higher for the year.
Of course, when you price in the “best of all worlds”, anything less than perfection is likely to be punished, and that is exactly what happened when some of these optimistic economic assumptions came under question as the calendar turned from July to August. Fears that the Federal Reserve had kept interest rates too high for too long, and that the economy was tipping into recession, gained significant (albeit temporary) credibility with the Labor Department’s August 2nd release of the July employment report, which showed that the economy produced a paltry 114,000 new jobs during the month, which was 61,000 jobs less than expected.1 This pushed the unemployment rate up to 4.3%.
Despite the fact that this employment number was probably significantly distorted by the impact of Hurricane Beryl, this weak report, when combined with a few other recent pieces of disappointing economic data, cast doubt upon this premise of “perfect balance” and helped to accelerate an 8% high-to-low decline in the S&P 500 Index (from 5,566.16 to 5,119.26) over the course of the first week of August.
While we believe that Hurricane Beryl probably made last month’s job growth look worse than it actually was, that news was dwarfed by the Bureau of Labor Statistics August 22nd release of a major revision to their calculations on job growth, which showed that their assumptions were vastly over optimistic, and that they had overstated payroll gains by a massive 818,000 for the 12 months ended in March.2
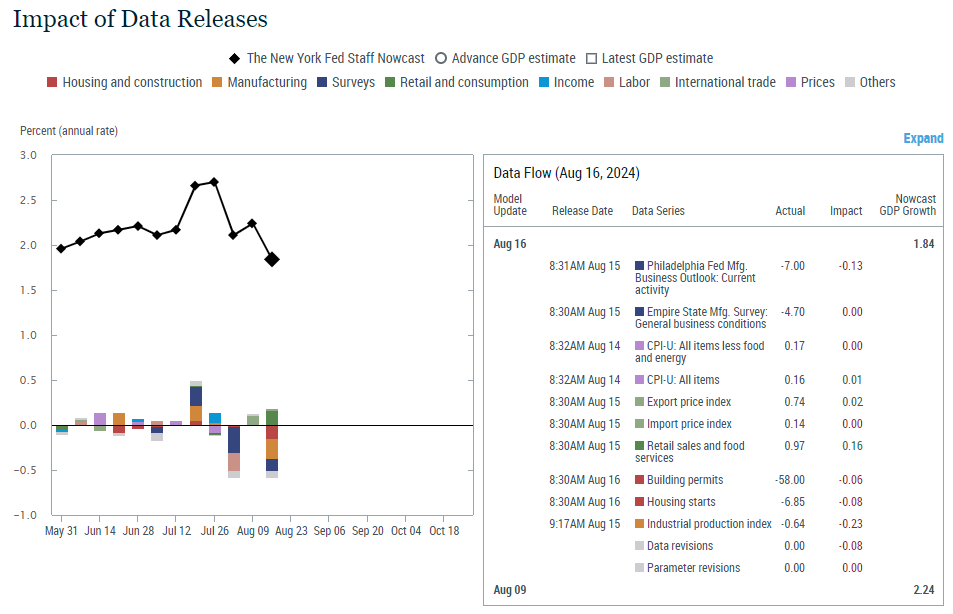
Moreover, as you can see in the below chart of the New York Fed GDP Nowcast (shown below as the solid black line)3, which attempts to gauge the strength of the economy in real time, not only has the economy been slowing over recent months, but also that the impetus for the slowing goes far beyond a weakening employment picture. Indeed, as is shown by the color codes, the New York Fed is seeing a slowing in building permits & housing starts (red), the manufacturing sector (dark blue), industrial production (gold) and in recent negative revisions to economic data (grey).
Economic slowing is not in and of itself necessarily a bad thing, as a slower economy should both help to bring inflation down towards the Fed’s 2% target and create some slack in what has been a problematically tight labor market and a relative shortage of available and qualified workers.
From our perspective, the critical question is not whether the economy is slowing, but instead whether or not it will slow so much that it slips into recession, which we believe cannot be dismissed entirely as a risk, as monetary policy has historically worked with a 12-to-18-month lag. This means that the past two-plus years of elevated interest rates could ultimately still catalyze an economic contraction.
That said, as we will illustrate below, both market pricing and sentiment/opinion polls show that a “soft landing” is still the overwhelming consensus expectation. Federal Reserve Chairman Powell also seems increasingly confident in such a benign outcome. As he noted in his August 23rd speech at the Jackson Hole Economic Symposium:
“Four and a half years after COVID-19’s arrival, the worst of the pandemic-related economic distortions are fading. Inflation has declined significantly. The labor market is no longer overheated, and conditions are now less tight than those that prevailed before the pandemic. Supply constraints have normalized. And the balance of the risks to our two mandates has changed. Our objective has been to restore price stability while maintaining a strong labor market, avoiding the sharp increases in unemployment that characterized earlier disinflationary episodes when inflation expectations were less well anchored. While the task is not complete, we have made a good deal of progress toward that outcome.”4
Regarding inflation, Powell went on to say that “after a pause earlier this year, progress toward our 2 percent objective has resumed. My confidence has grown that inflation is on a sustainable path back to 2 percent” and that “the time has come for policy to adjust” (i.e., for the Fed to start lowering rates). He went on to say that “the direction of travel is clear, and the timing and pace of rate cuts will depend on incoming data, the evolving outlook and the balance of risks.”5
Regarding the other side of the proverbial “coin”, Chairman Powell noted that “the cooling in labor market conditions is unmistakable”, while offering assurances that members of the Fed Open Market Committee will “do everything we can to support a strong labor market as we make further progress toward price stability”6 (i.e., the dual mandate).
Powell went on to say that “there is good reason to think that the economy will get back to 2 percent inflation while maintaining a strong labor market” and that “the current level of our policy rate gives us ample room to respond to any risks we may face, including the risk of unwelcome further weakening in labor market conditions.”7
For reasons that we will discuss below, history suggests that this question of recession versus “soft landing” may become quite important from a portfolio perspective, as the performance of different asset classes has historically varied quite dramatically during periods of recession.
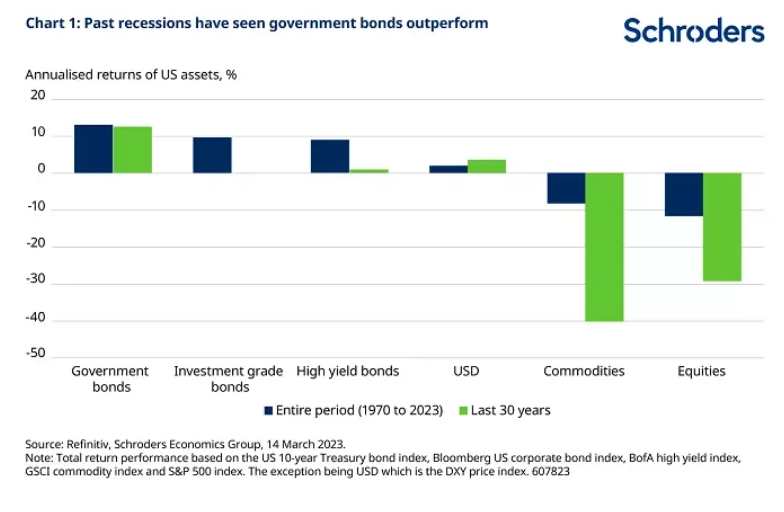
With the very important caveat that past performance is not necessarily indicative of future results, this significant historical variance in returns is driven home in a report from Fidelity, which notes that “during the 11 recessions the US has endured since 1950, stocks have historically fallen an average of 15% a year…[while]…bonds have historically thrived when the economy has contracted. In every recession since 1950, bonds have delivered higher returns than stocks and cash.”8
Further, as you can see in the previous graphic, higher quality bonds, like government bonds and investment-grade corporate bonds, have historically provided the best returns during recessions, while more cyclical asset classes like commodities and most stock sectors tend to perform the worst. However, we would caution that many of the potential benefits to the bond market of an economic slowdown may have already been reflected in the prices of fixed income investments in general and higher-quality debt in particular.
Indeed, according to Bloomberg, bond market bullishness is so high at present that “bond traders are taking on a record amount of risk as they bet big on a Treasury market rally”, and that “the number of leveraged positions in Treasury futures has risen to an all-time high”.9
It is worth noting that such periods of bullish euphoria are often associated with markets that are overly optimistic, complacent, and which may have already, at least in the short term, advanced too far too fast. This may be a particular risk to income investors at present if, as most economists and money managers seem to expect, the economy avoids recession.
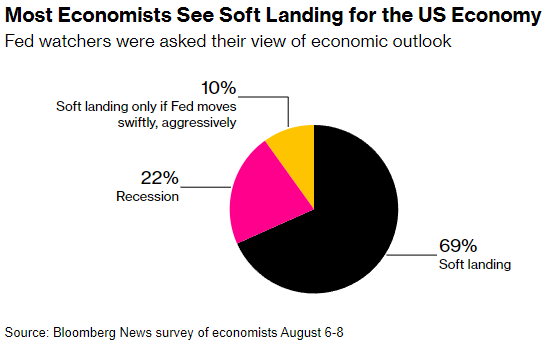
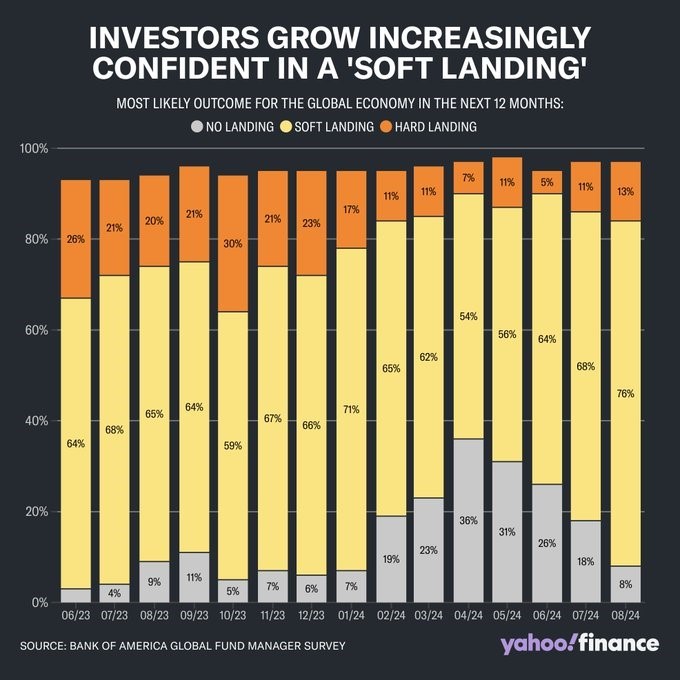
As noted, while there is no guarantee that their expectations will come to pass, surveys of both economists and portfolio managers echo Chairman Powell’s economic optimism. As you can see above, almost 70% of Wall Street economists polled by Bloomberg are expecting a soft landing. Further, as shown by the August Bank of America Global Fund Manager Survey (see below), 76% of polled money managers are optimistic regarding the outlook for a soft landing.
While a perceived declining risk of recession is like a lessening headwind (at least for equities), the seemingly inevitable lowering of interest rates by the Federal Reserve should provide a strengthening tailwind, particularly in smaller-capitalization stocks which, as we addressed at length in last month’s report, tend to be much more sensitive to changes in interest rates, due to their higher debt levels and greater reliance on adjustable-rate debt.
According to Denise Chisholm, Director of Quantitative Market Strategy at Fidelity, when rates fall, equal-weighted multiples expand 10-20% more than large cap multiples, the opposite of what happens when rates rise.10 Put another way, history suggests that, when rates are falling, the price that investors are willing to pay for each dollar of earnings produced by the “average” stock increases by 10% to 20% more than it does for the very largest stocks.
This willingness to pay higher price-to-earnings multiples on smaller stocks has historically allowed for the traditional expansion in market breadth (the percentage of stocks participating in the advance) and the potential for outperformance by smaller and more-value-oriented (less highly valued) stocks.
While the level and trend of interest rates has historically been among the most important influences on the equity markets, and while lower rates are generally perceived as being very bullish, the lesson from history is that it is very important to consider just why it is that rates are falling. Remember that most catalysts for lower rates have historically been negative macro-economic factors, such as dysfunction in the financial system, a sharp rise in unemployment or an impending and unusually severe recession. This is where that “soft landing” versus recession question becomes so important.
As is illustrated in the below chart from Advisorpedia11, there have been 12 rate cutting cycles in the U.S. since 1965. The average return for the Standard & Poor’s 500 Index in the 12 months after the first cut has actually been very sub-par at only 5% per year. The biggest determinant of performance appears to have been whether the economy managed to stay out of recession over that 12-month period. The difference in average annual return between recession (-3% average) and no recession (+15%) is a whopping 18%.
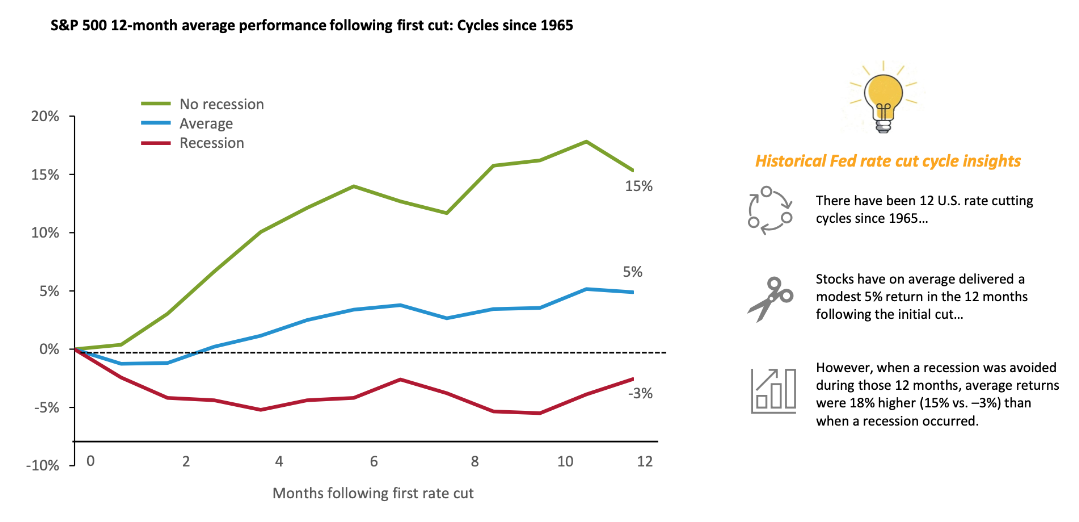
Just a reminder that past performance is not necessarily indicative of future results. That said, it will be important to keep an eye on the health of the U.S. economy in general, and the jobs market in particular.
Of note, while lower interest rates have historically been more impactful on smaller company stocks than on their larger, blue-chip brethren, smaller stocks have also traditionally been more sensitive to changes in the economy. You can see some of this economic sensitivity reflected in the following chart of the S&P 600 Index.
Importantly, the below S&P 600 Small Cap Index is notably different than the much more commonly referenced Russell 2000 Small Cap Index. The S&P 600 only includes profitable companies, whereas 41% of Russell 2000 companies have negative earnings.12
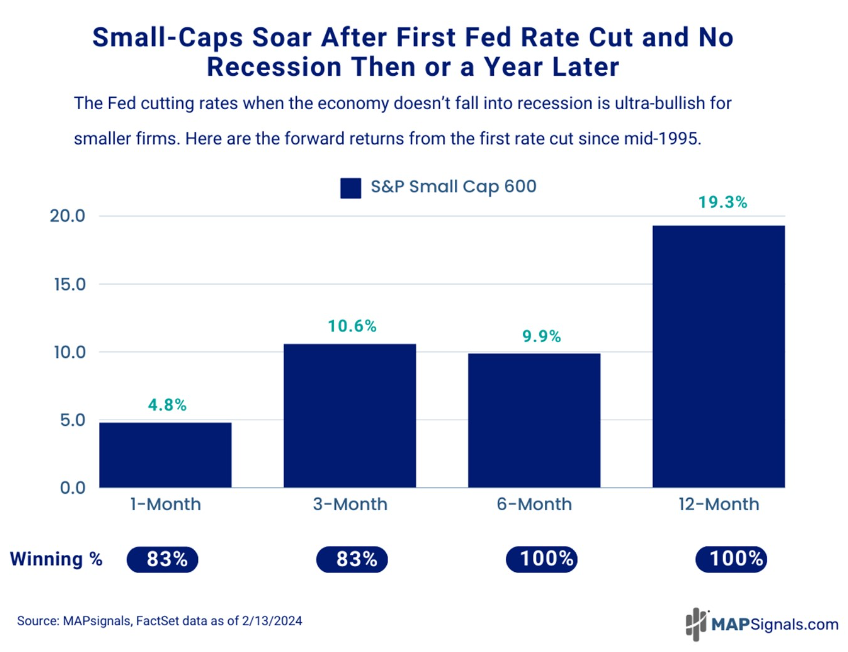
With a historically high frequency of positive 1, 3, 6 and 12-month returns and higher than average historical returns, you can start to appreciate why investors might be so bullish about the potential combination of strong earnings, a sustainable economy, normalizing inflation and lower interest rates. Remember that the past is not necessarily prologue!
It is also important to keep in mind that such a beneficial confluence of events is already the strong consensus opinion, which suggests that much of this good news is already priced into the markets. Markets almost never go up on the same news twice.
It is also true that, while we do expect the bull market to continue broadening out beyond the recent mega-cap technology stock leadership and into smaller and more value-oriented stocks, such an improvement in market breadth has normally taken place after the nadir of the slowdown, when earnings and the economy are both accelerating and rates are still declining. As discussed in last month’s Outlook, we think that will be a 2025 phenomenon.
In addition, the Fed’s decision to shift its emphasis from battling inflation to supporting employment raises the risk that inflation may not return to the Fed’s 2% target, which could have longer-term implications.
That said, all things considered, we believe that the bullish factors outweigh the bearish ones, and that it makes sense for equity investors to take advantage of any attractive buying opportunities, and for income-oriented investors to start moving out of money markets and ultra-short-term debt and into more-intermediate-term debt, where they can lock in today’s relatively attractive rates. Whether debt or equity, we generally continue to favor domestic opportunities over foreign and high-quality over more speculative investments.
Disclosures
Advisory services offered through Per Stirling Capital Management, LLC. Securities offered through B. B. Graham & Co., Inc., member FINRA/SIPC. Per Stirling Capital Management, LLC, DBA Per Stirling Private Wealth and B. B. Graham & Co., Inc., are separate and otherwise unrelated companies.
This material represents an assessment of the market and economic environment at a specific point in time and is not intended to be a forecast of future events, or a guarantee of future results. Forward-looking statements are subject to certain risks and uncertainties. Actual results, performance, or achievements may differ materially from those expressed or implied. Information is based on data gathered from what we believe are reliable sources. It is not guaranteed as to accuracy, does not purport to be complete and is not intended to be used as a primary basis for investment decisions. It should also not be construed as advice meeting the particular investment needs of any investor.
Nothing contained herein is to be considered a solicitation, research material, an investment recommendation or advice of any kind. The information contained herein may contain information that is subject to change without notice. Any investments or strategies referenced herein do not take into account the investment objectives, financial situation or particular needs of any specific person. Product suitability must be independently determined for each individual investor.
This document may contain forward-looking statements based on Per Stirling Capital Management, LLC’s (hereafter PSCM) expectations and projections about the methods by which it expects to invest. Those statements are sometimes indicated by words such as “expects,” “believes,” “will” and similar expressions. In addition, any statements that refer to expectations, projections or characterizations of future events or circumstances, including any underlying assumptions, are forward-looking statements. Such statements are not guarantying future performance and are subject to certain risks, uncertainties and assumptions that are difficult to predict. Therefore, actual returns could differ materially and adversely from those expressed or implied in any forward-looking statements as a result of various factors. The views and opinions expressed in this article are those of the authors and do not necessarily reflect the views of PSCM’s Investment Advisor Representatives.
Neither asset allocation nor diversification guarantee a profit or protect against a loss in a declining market. They are methods that can be used to help manage investment risk.
A bond’s yield, price and total return can change daily and are based on changes in interest rates, market conditions, economic and political news, and the quality and maturity of its investments. In general, bond prices fall when interest rates rise and vice versa.
Compared to higher rated securities, high yield bond investment options are subject to greater risk, including the risk of default.
Small capitalization securities involve greater issuer risk than larger capitalization securities, and the markets for such securities may be more volatile and less liquid. Specifically, small capitalization companies may be subject to more volatile market movements than securities of larger, more established companies, both because the securities typically are graded in lower volume and because the issuers typically are more subject to changes in earnings and prospects.
The value of commodity-linked investments may be affected by financial factors, political developments and natural disasters. As such, investment options that invest primarily in commodities may experience greater volatility than investments in traditional securities.
Past performance is no guarantee of future results. The investment return and principal value of an investment will fluctuate so that an investor’s shares, when redeemed, may be worth more or less than their original cost. Current performance may be lower or higher than the performance quoted.
Definitions
The Consumer Price Index (CPI), which is produced by the Bureau of Labor Statistics, is a measure of the average change over time in the prices paid by urban consumers for a market basket of consumer goods and services. Indexes are available for the U.S. and various geographic areas. Average price data for select utility, automotive fuel, and food items are also available.
The Standard & Poor’s 500 (S&P 500) is a market-capitalization-weighted index of the 500 largest publicly-traded companies in the U.S with each stock’s weight in the index proportionate to its market. It is not an exact list of the top 500 U.S. companies by market capitalization because there are other criteria to be included in the index.
The S&P SmallCap 600® seeks to measure the small-cap segment of the U.S. equity market. The index is designed to track companies that meet specific inclusion criteria to ensure that they are liquid and financially viable.
The Russell 2000 Index measures the performance of approximately 2,000 small-cap companies in the Russell 3000 Index, which is made up of 3,000 of the biggest U.S. stocks. The Russell 2000 serves as a benchmark for small-cap stocks in the United States.
You cannot invest directly into an index.
Citations
-
“Employment in Pictures – Sahm Rule Triggered”, Jim Bianco, Posted 8/2/2024, https://www.biancoresearch.com/tag/monthly-reports/
-
“The Job Market Is a Lot Weaker Than Reported. What That Means for the Fed and Rate Cuts.”, Megan Leonhardt, Posted 8/21/2024, https://www.barrons.com/livecoverage/stock-market-today-082124/card/the-job-market-is-a-lot-weaker-than-reported-revised-data-show-J1V9uDbpLgH9ps66GmBX
-
“New York Fed Staff Nowcast”, Federal Reserve Bank of New York, Posted 8/23/2024, https://www.newyorkfed.org/research/policy/nowcast#/nowcast
-
“Review and Outlook”, Jerone H. Powell, Posted 8/23/2024, https://www.federalreserve.gov/newsevents/speech/powell20240823a.htm
-
“Review and Outlook”, Jerone H. Powell, Posted 8/23/2024, https://www.federalreserve.gov/newsevents/speech/powell20240823a.htm
-
“Review and Outlook”, Jerone H. Powell, Posted 8/23/2024, https://www.federalreserve.gov/newsevents/speech/powell20240823a.htm
-
“Review and Outlook”, Jerone H. Powell, Posted 8/23/2024, https://www.federalreserve.gov/newsevents/speech/powell20240823a.htm
-
“Bond market outlook”, Fidelity Institutional, As of 8/23/2024, https://institutional.fidelity.com/app/item/RD_9908211/bond-market-outlook.html#:~:text=In%20every%20recession%20since%201950,and%20bond%20prices%20to%20rise
-
“Bond Traders Amassing Historic Level of Risk on Rate-Cut Bets”, Edward Bolingbroke, Posted 8/20/2024, https://www.bloomberg.com/news/articles/2024-08-20/bond-traders-amassing-historic-level-of-risk-on-rate-cut-bets?sref=YfRIauRL
-
“Charts of the Week: Continued Positive Signals for Equal-Weighted Indices”, Denise Chisholm, Posted 7/26/2024, https://www.linkedin.com/pulse/charts-week-continued-positive-signals-equal-weighted-denise-chisholm-nqzbe/
-
“What Has Happened When the Fed Cuts Rates?”, Advisorpedia, 8/22/2024, https://www.advisorpedia.com/chart-center/what-has-happened-when-the-fed-cuts-rates/
-
“41% of companies in the Russell 2000 have negative earnings”, Apollo, 5/5/2024, https://www.apolloacademy.com/wp-content/uploads/2024/05/051024-Charts_v2.pdf