17
MarchPer Stirling Capital Outlook – March

To paraphrase Sir John Templeton, “Bull markets are born in despair, grow in pessimism, mature in optimism, and die in euphoria”.
Stock market declines can be a wonderful thing. It just does not feel like it when you are in the midst of the storm.
Bear markets (declines of 20% or more) and corrections (declines of 10% to 20%) are both normal and necessary, as they remove (or at least lessen) speculative excesses. They create opportunities by lowering equity valuations and introducing pricing inefficiencies, and they can restore a healthy level of sideline cash that can be used to power the next bull market. Perhaps most importantly, they turn bulls into bears.
This last point can be all-important, as it is ultimately the process of turning those bears back into bulls that will likely prove essential to the next bull market advance.
So, how do you know when a market decline has been sufficient to accomplish the aforementioned results, and that the time has come to switch portfolio allocations from defense to offense? Unfortunately, the answer is that you never know for sure, as every market cycle is different and, as the old saying goes, “nobody rings a bell at market tops and bottoms”.
That said, there are certain conditions and factors that are common to most significant market lows. We will use the opportunity of this commentary to discuss some of those elements, and to consider them in light of the current equity market decline.
As you might assume from the opening John Templeton perspective, one of the most important prerequisites for a bottom is a significant shift in investor sentiment from bullishness to bearishness, and this traditional catalyst for a market bottom is already giving some indications that a substantial market low could be within sight.
Indeed, investor sentiment is reaching the kind of bearish extremes that have historically often occurred in the vicinity of at least temporary market lows. The premise is that such extreme bearishness is potentially indicative of “seller exhaustion” (i.e., a condition where a majority of potential sellers have already sold).
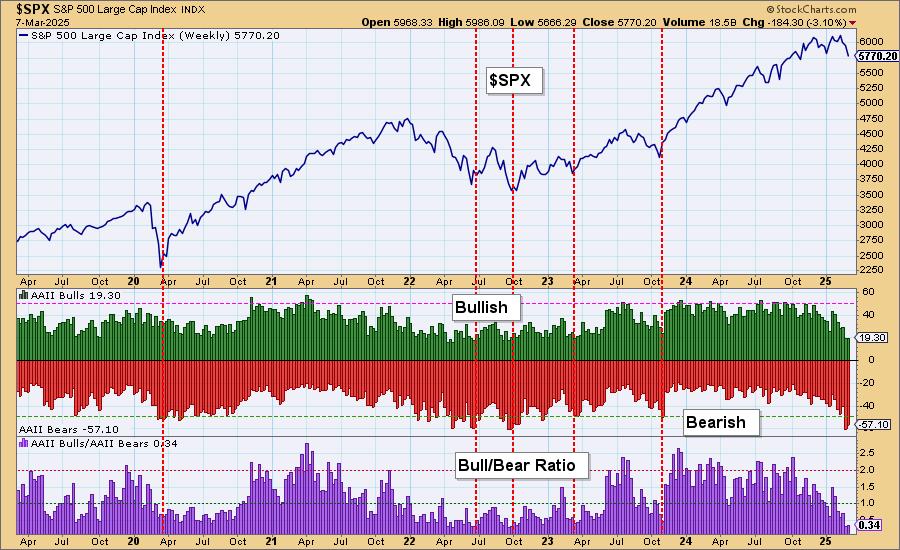
One of the very useful tools for measuring market sentiment is the weekly survey by the American Association of Individual Investors (AAII). It is a single-question survey that simply asks if the respondent thinks that the S&P 500 Index will be higher, lower or unchanged from current levels in six months’ time.
In the above chart, the 57% that expect prices to be lower are illustrated by the red bars, the 19% who expect prices to be higher are represented by the green bars, and the purple bars show the ratio of bulls divided by bears. While the past is not necessarily indicative of future results, a look at the red, dotted, vertical lines shows that such extreme levels of bearish sentiment (the very “short” purple bars) have often been associated with either market bottoms or at least tradable market lows.
Another measure that we find very useful, and which is also showing indications of extreme caution, is the CNN Fear and Greed Index.
Unlike the above AAII survey of investor sentiment, the CNN index examines seven different measures of risk appetite to gauge investor confidence and sentiment. The 7 so-called “Fear & Greed” indicators include 1) stock market momentum, 2) stock price strength, 3) stock price breadth, 4) the put/call ratio (bearish options divided by bullish options), 5) stock market volatility, 6) the demand for “safe haven” assets (such as Treasury securities), and 7) the demand for non-investment grade “junk” bonds. All things considered, the measure is currently reading 20 on a scale of 100, which suggests that there is “extreme fear” in the markets, which is traditionally bullish from a contrarian perspective.
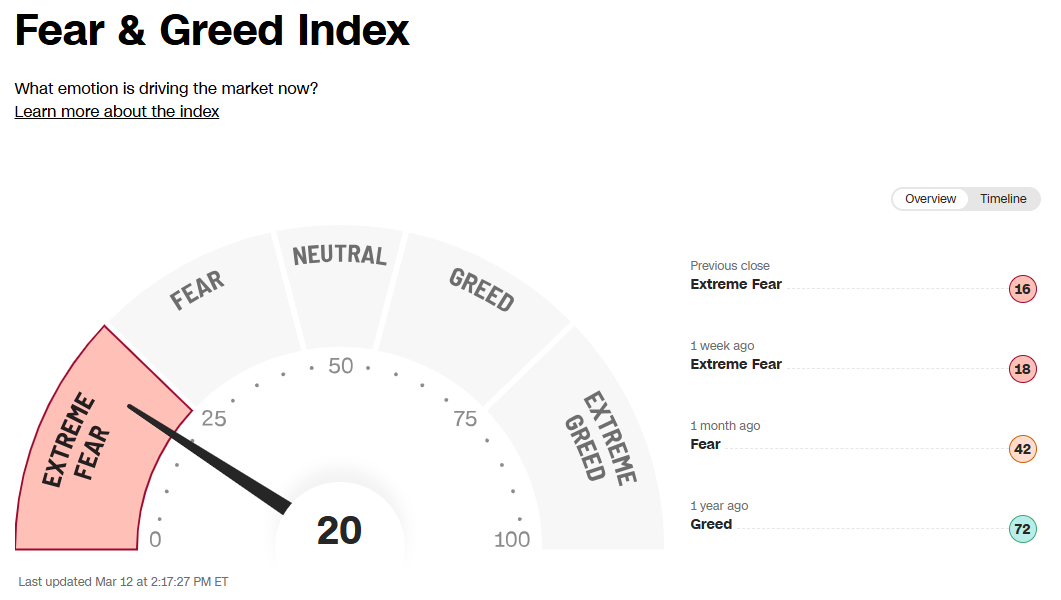
However, this indicator has actually reached low single-digit readings at some prior major market lows so, while such a cautious reading suggests that much of the recent levels of excessive bullishness may have already been wrung out of the markets (and perhaps even that stocks might be due for a short-term rally), we have yet to see much evidence of capitulation, which is another of the very important elements normally associated with a substantial and sustainable stock market low.
Capitulation might be best described as the state where investors give up hope and adopt a “get me out at all costs” investment strategy. It is normally closely associated with very high trading volume, the number of declining stocks dramatically exceeding the number of advancing stocks, and a spike in the VIX “fear index”, which measures the level of price volatility that investors expect over the next thirty days.
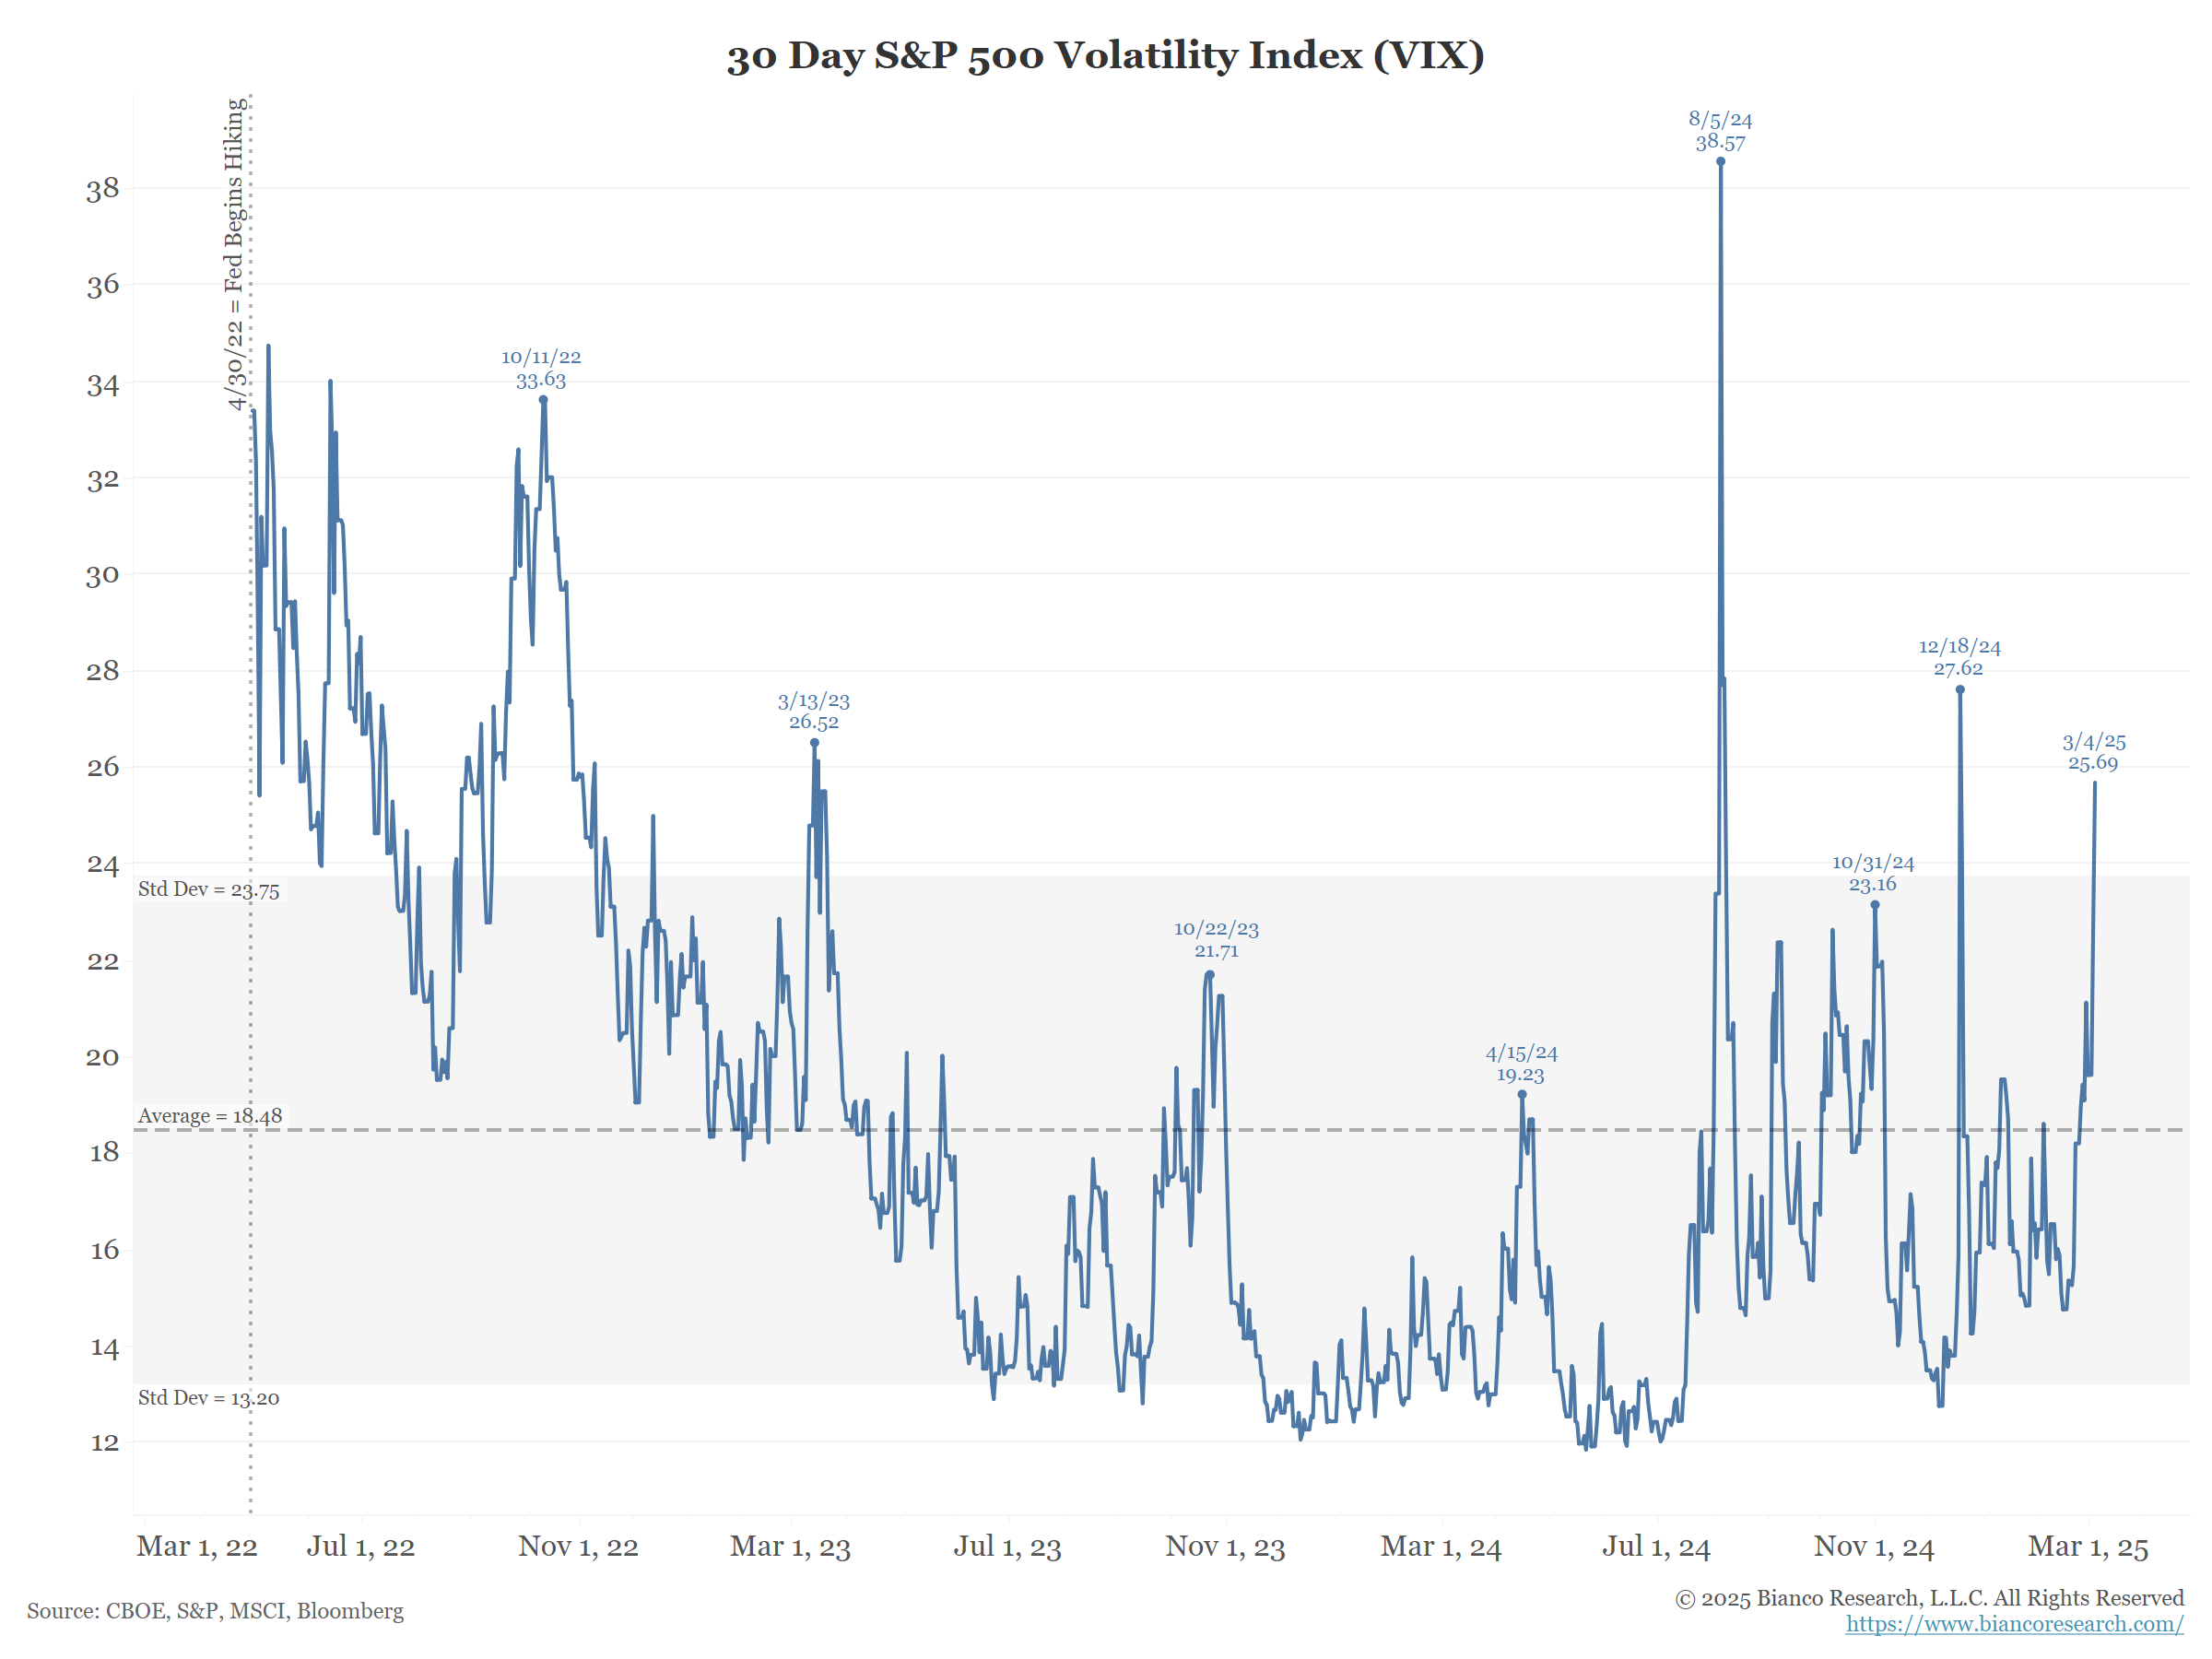
While you can see in the previous chart that the VIX Index is starting to spike higher (up to 24.5 as of the day of this report), important market lows are more commonly associated with spikes in the VIX to at least 30 or 35. Moreover, we have still not seen the massive surge in trading volume normally associated with sustainable market bottoms. This makes us suspect that the recent bout of equity market selling may not be over quite yet.
Another characteristic that you ideally want to see at a sustainable market low is inexpensive equity market valuations (share prices compared to expected company earnings).
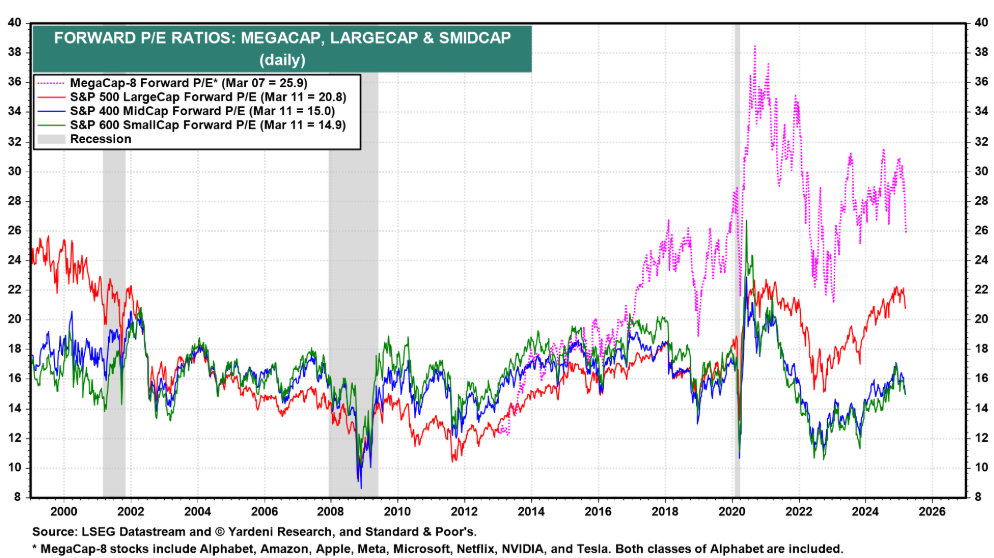
The good news is that the S&P 500 has gone from trading at over 22 times next year’s expected earnings to less than 21 times expected earnings and that large-capitalization growth stocks as represented by the so-called “Mega-Cap 8” (Alphabet, Amazon, Apple, Meta, Microsoft, Netflix, NVIDIA and Tesla) have recently gone from selling at over 30 times next year’s expected earnings to less than 26 times expected earnings.1
The bad news is that stocks have gone from being “extraordinarily expensive” to only “very expensive”. The current price-to-earnings multiple of 20.8 times expected earnings compares to a five-year average of 19.6, a ten-year average of 18.1, a fifteen-year average of 16.4, a twenty-year average of 15.8 and a twenty-five-year average of 16.4. As a result of the recent decline, valuations have become cheaper, but are, based on historical averages, definitely not yet cheap.2
There are a few other characteristics that we like to look for as an indication of an equity market bottom. One of those is that we want to see the stock market rally during the last hour of trading. The rationale for this is the broadly accepted premise that amateur and individual investors tend to trade at the beginning of the day, while institutions and professional investors (who are presumably more experienced and more sophisticated) tend to trade at the very end of the day.
The fact that the stock market continues to show weakness in the last hour of trading suggests that the so-called “smart money” is still bearish while the so-called “dumb money” is buying in the morning what investment experts are selling near the close of trading.
As noted previously, every market cycle is different, and that is certainly true again this time. One of the biggest differences is illustrated in the following chart, which shows (in the top section) the percentage of bullish respondents to the American Association of Individual Investors Survey over the past 35 years. The red sections illustrate the few times in history when the level of bullishness has been lower than the current level.
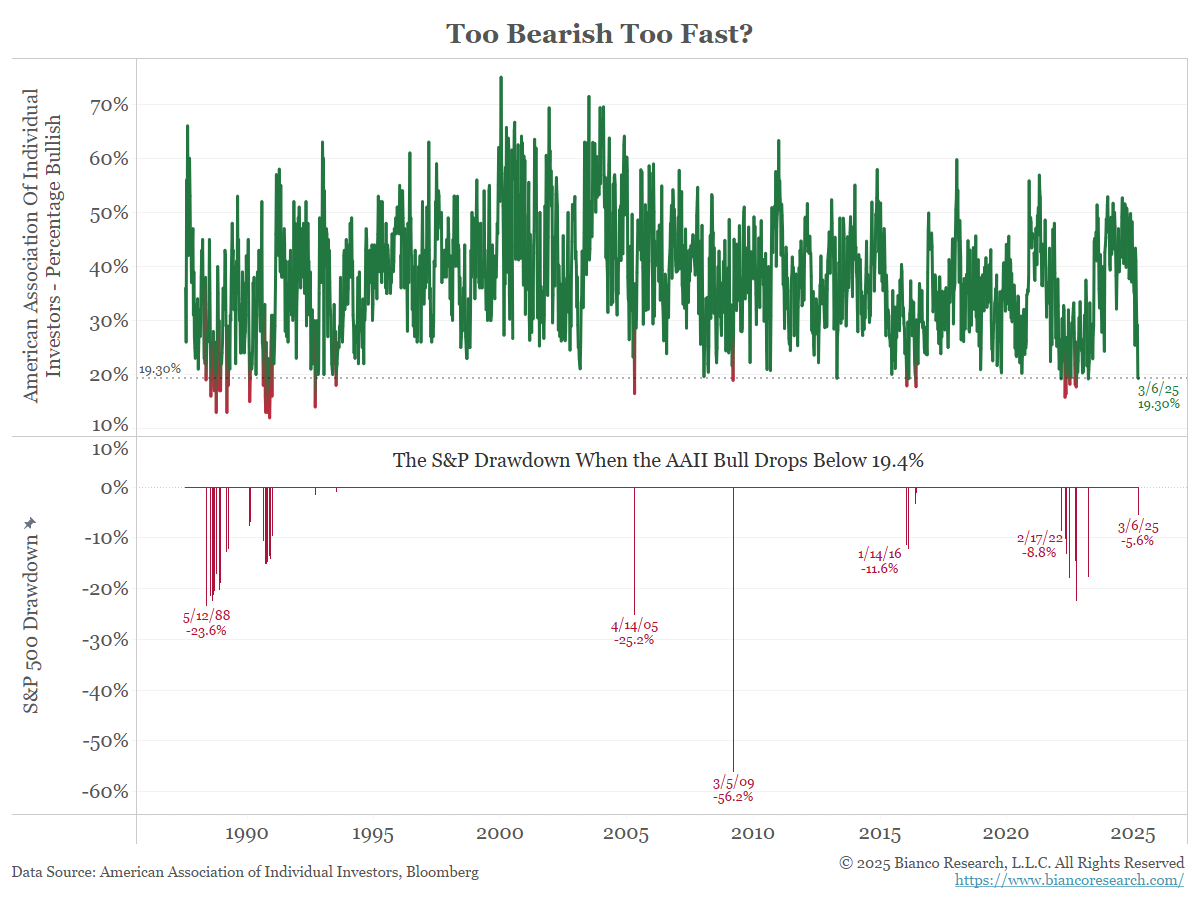
The bottom part of the chart illustrates the level of losses in the S&P 500 Index that were necessary to catalyze such excessively low levels of bullishness. This included losses of 23.6%, 25.2%, 56.2%, 11.6%, and 8.8%. However, this time, it only required losses (as of the date of the last survey period) of only 5.6%, which suggests to us that it may not be the portfolio losses themselves that have catalyzed this bearish sentiment.
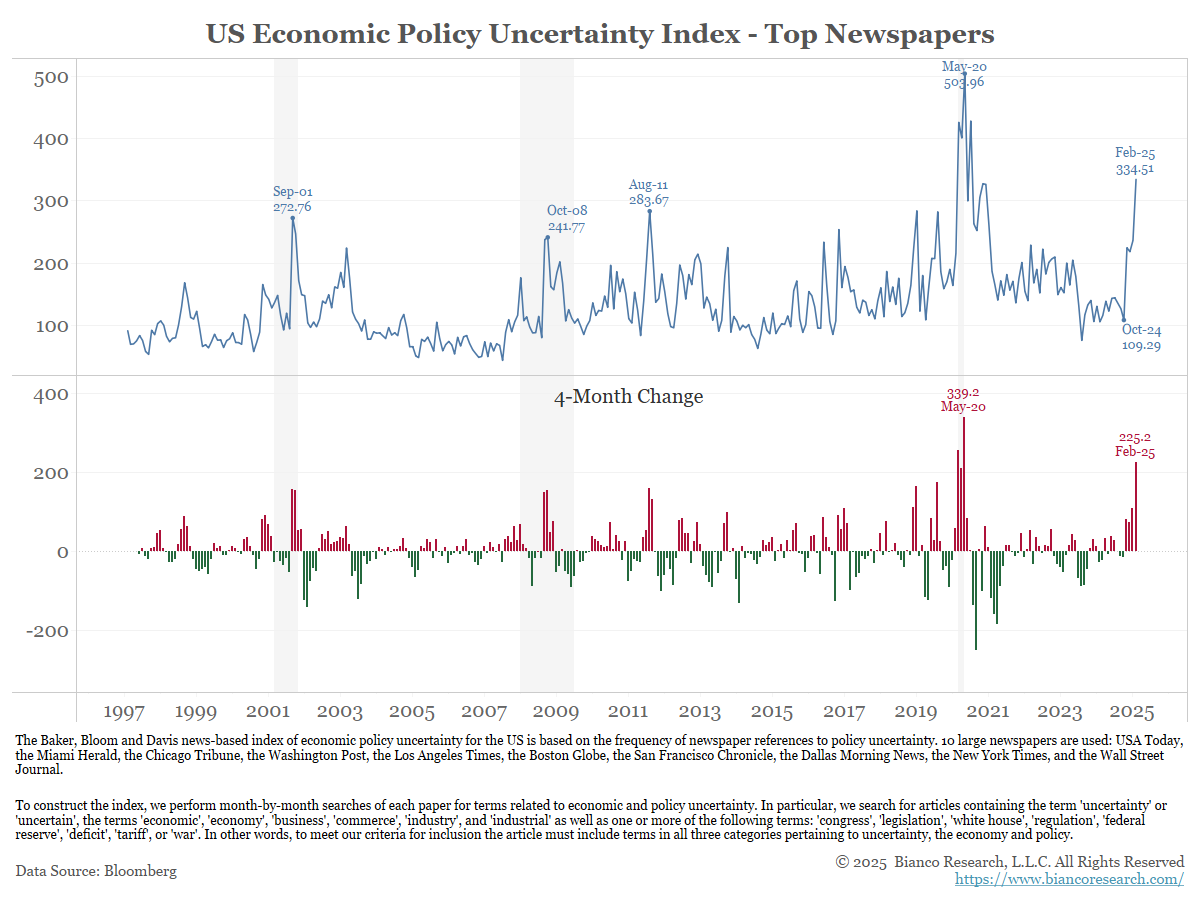
We suspect that it is instead attributable to the level of policy uncertainty (as measured by the headlines contained in the country’s major newspapers) that is coming out of Washington, D.C. You will note in the above chart that, in the history of this index, current levels of perceived uncertainty are even higher now than they were during both the Global Financial Crisis and immediately after the 9/11 attacks. Indeed, the only measured period with greater uncertainty was during the COVID-driven shutdown of most of the global economy.
This point brings us to one of the final things that we look for as we attempt to identify a market low, which are indications that the worst of the “bad news” is already fully reflected in stock prices. As evidence of such a condition, we often look for instances when stock prices rally in the face of “bad” news.
This helps to explain why we think that it is still too early to look for signs of a sustainable market bottom, as it will be hard for investors to fully price in the worst of the “bad news” when additional negative news and new causes for investor uncertainty continue to be introduced on the policy front on an almost daily basis.
All of that being said, we do suspect that we are much closer to the end of this pullback than we are to the beginning, and even that, if the Trump administration is ultimately successful in addressing the excessive levels of government spending and America’s ever-expanding debt, it will result in a healthier economic environment that should benefit investors over the longer term.
In the meantime, prepare for a bumpy ride, be mindful of the aforementioned signs of a potential market bottom, and keep in mind that investing, by its very nature, requires a longer-term perspective.
Disclosures
Advisory services offered through Per Stirling Capital Management, LLC. Securities offered through B. B. Graham & Co., Inc., member FINRA/SIPC. Per Stirling Capital Management, LLC, DBA Per Stirling Private Wealth and B. B. Graham & Co., Inc., are separate and otherwise unrelated companies.
This material represents an assessment of the market and economic environment at a specific point in time and is not intended to be a forecast of future events, or a guarantee of future results. Forward-looking statements are subject to certain risks and uncertainties. Actual results, performance, or achievements may differ materially from those expressed or implied. Information is based on data gathered from what we believe are reliable sources. It is not guaranteed as to accuracy, does not purport to be complete and is not intended to be used as a primary basis for investment decisions. It should also not be construed as advice meeting the particular investment needs of any investor.
Nothing contained herein is to be considered a solicitation, research material, an investment recommendation or advice of any kind. The information contained herein may contain information that is subject to change without notice. Any investments or strategies referenced herein do not take into account the investment objectives, financial situation or particular needs of any specific person. Product suitability must be independently determined for each individual investor.
This document may contain forward-looking statements based on Per Stirling Capital Management, LLC’s (hereafter PSCM) expectations and projections about the methods by which it expects to invest. Those statements are sometimes indicated by words such as “expects,” “believes,” “will” and similar expressions. In addition, any statements that refer to expectations, projections or characterizations of future events or circumstances, including any underlying assumptions, are forward-looking statements. Such statements are not guarantying future performance and are subject to certain risks, uncertainties and assumptions that are difficult to predict. Therefore, actual returns could differ materially and adversely from those expressed or implied in any forward-looking statements as a result of various factors. The views and opinions expressed in this article are those of the authors and do not necessarily reflect the views of PSCM’s Investment Advisor Representatives.
Past performance is no guarantee of future results. The investment return and principal value of an investment will fluctuate so that an investor’s shares, when redeemed, may be worth more or less than their original cost. Current performance may be lower or higher than the performance quoted.
Definitions
The Standard & Poor’s 500 (S&P 500) is a market-capitalization-weighted index of the 500 largest publicly-traded companies in the U.S with each stock’s weight in the index proportionate to its market. It is not an exact list of the top 500 U.S. companies by market capitalization because there are other criteria to be included in the index.
The VIX is a trademarked ticker symbol for the Chicago Board Options Exchange Market Volatility Index, a popular measure of the implied volatility of S&P 500 index options. Often referred to as the fear index or the fear gauge, it represents one measure of the market’s expectation of stock market volatility over the next 30-day period.
Indices are unmanaged and investors cannot invest directly in an index. Unless otherwise noted, performance of indices does not account for any fees, commissions or other expenses that would be incurred. Returns do not include reinvested dividends.
Citations
-
“Stock Market P/E Ratios”, Yardeni Research, As of 3/13/2025, https://yardeni.com/charts/stock-market-p-e-ratios/
-
“Highest Forward 12-Month P/E Ratio For the S&P 500 in More Than 3 Years”, John Butters, Posted on 11/11/2024, https://insight.factset.com/highest-forward-12-month-p/e-ratio-for-the-sp-500-in-more-than-3-years#:~:text=How%20does%20this%2022.2%20P,25%2Dyear%20(16.4)