10
AprilPer Stirling Capital Outlook – April

In the March Per Stirling Capital Outlook, we cautioned that, while the equity markets were already approaching “correction” territory (generally defined as a decline of between 10% and 20%), and while many gauges of investor sentiment were already quite bearish, “we have yet to see much evidence of capitulation, which is another of the very important elements normally associated with a substantial and sustainable stock market low.
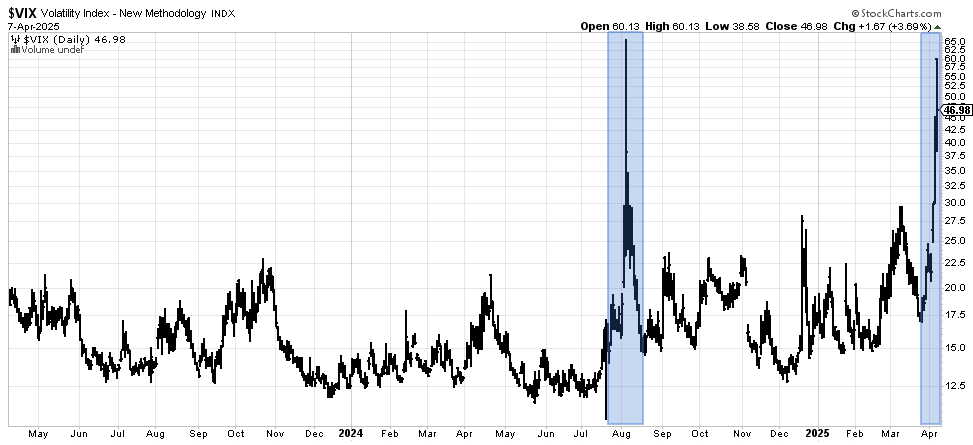
Capitulation might be best described as the state where investors give up hope and adopt a “get me out at all costs” investment strategy. It is normally closely associated with very high trading volume, the number of declining stocks dramatically exceeding the number of advancing stocks, and a spike in the VIX Volatility Index (a.k.a. the “fear index”), which measures the level of price volatility that investors expect over the next thirty days.”
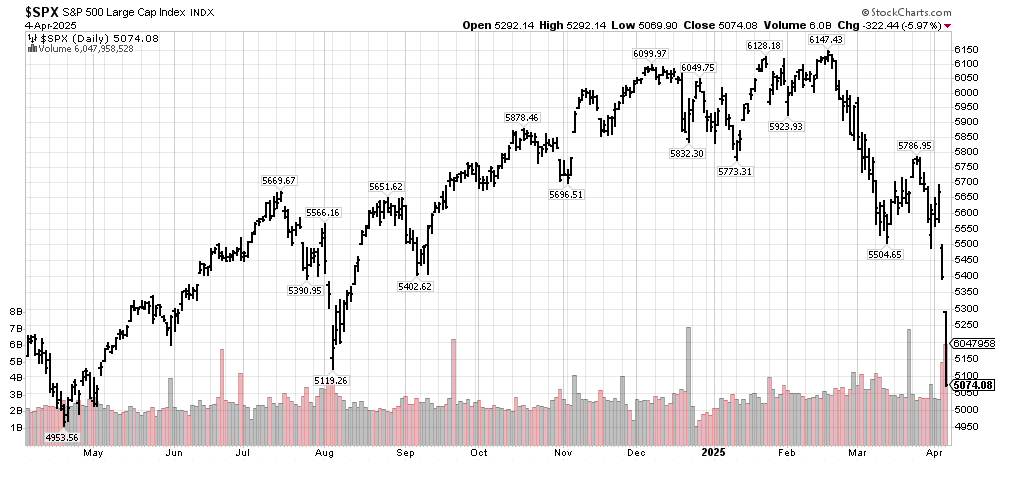
The good news (and in the very short term potentially the bad news) is that we are finally seeing signs of capitulation, panic, and even forced selling, which are some of the more important elements normally associated with significant lows in the stock market. Selling no longer looks like an orderly process of investors progressively and rationally reducing their exposures to equities. Ever since President Trump’s self-proclaimed April 2nd “Liberation Day”, the equity markets have suffered the most rapid decline of substance since March of 2020, when we witnessed the most violent stage of the COVID-19-driven bear market.
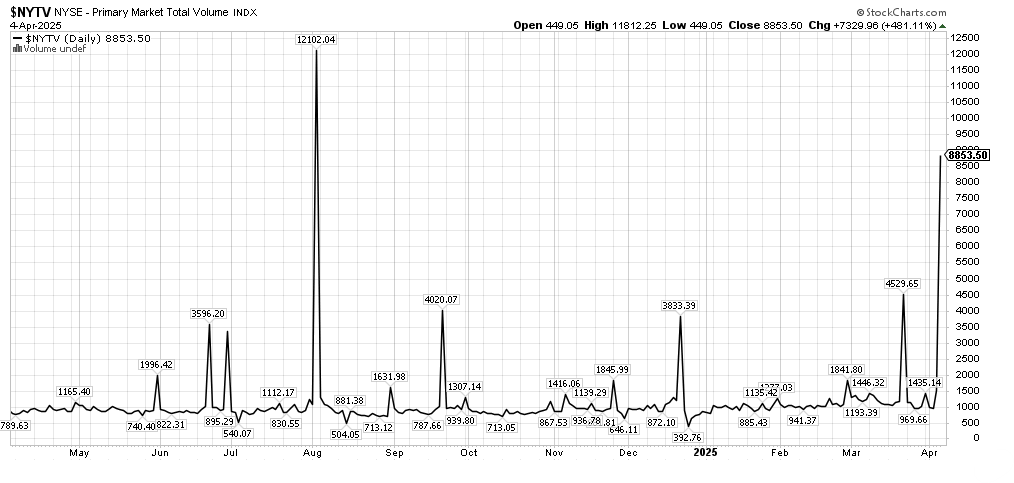
You will also note that the VIX (“fear index”) (above) has spiked to the highest levels since Japan’s surprise rate hike in August of last year (and the highest closing level since the pandemic panic in April of 2020). A similar message is being delivered by the massive surge in total New York Stock Exchange trading volume, which can be found two charts below, and which just reached the highest level since August of last year when Japan surprised the markets with a rate hike. Of note, the surprise rate hike was of outsized importance due to the “carry trade”, where (due to Japan’s negative interest rates) investors and institutions were being paid to borrow money in Japan and invest it elsewhere around the world. The rate hike made that long-standing trade much less attractive and catalyzed the global sell-off.
While the current environment is no doubt unnerving for most investors, each of these events are potentially encouraging, as they are traditionally not only requisites for a bear market bottom, but also that they often take place in the general vicinity of a significant market low. This provides us with some confidence that the “capitulation low” of the decline could take place relatively soon, and even that there is a growing probability that the equity markets could be reasonably higher than current levels by the end of the year.
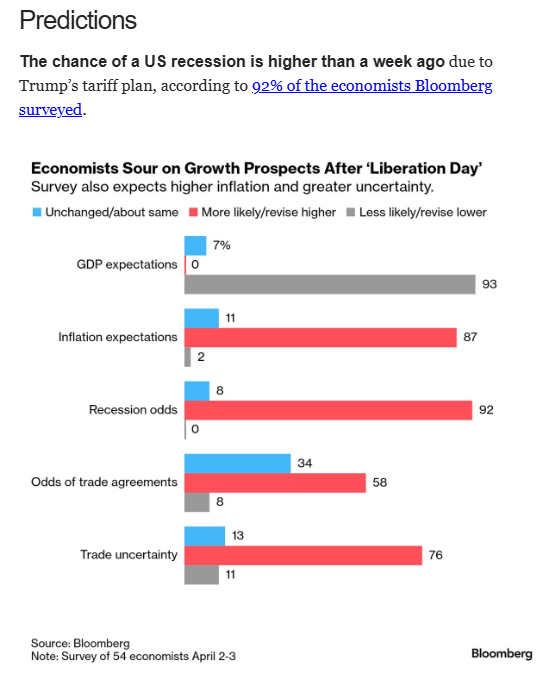
However, while we suspect that the market lows are likely fairly close in terms of time, that is no guarantee that things will not get worse before they get better. After all, as is illustrated in the below Bloomberg survey of 54 Wall Street economists on the impact of the much higher than expected tariffs announced on April 2nd, economic growth (GDP) expectations are being downgraded, inflation is expected to rise along with the odds of recession, and trade uncertainty is expected to increase. On the optimistic side, also expected to increase is the probability of successful trade negotiations.
According to J.P. Morgan’s Chief Economist, “the risk of recession in the global economy this year is raised to 60%, up from 40%, due to the tariffs, which are considered the largest tax hike on US households and businesses since 1968”.1 Further, as noted last Friday by Federal Reserve Chairman Jerome Powell, “We face a highly uncertain outlook with elevated risks of both higher unemployment and higher inflation….While tariffs are highly likely to generate at least a temporary rise in inflation, it is also possible that the effects could be more persistent.” 2
Indeed, there are a number of fairly extraordinary challenges associated with putting a bottom in place in the current environment. These include the fact that equity valuations remain historically high, which is likely to be complicated by growing expectations for declining corporate earnings.
Foreign selling is also a risk in both the stock and bond markets, due to the falling U.S. dollar, growing anti-American sentiment overseas, and this year’s historically large underperformance of U.S. stocks versus their foreign counterparts.
Another challenge is that the risk of stagflation (slow economic growth with high inflation) may at least temporarily keep the Fed from aiding the economy by lowering short-term interest rates, particularly with employment remaining quite strong. As Chairman Powell noted in a speech on April 4th, “Our obligation is to keep longer-term inflation expectations well anchored and to make certain that a one-time increase in the price level does not become an ongoing inflation problem….We are well positioned to wait for greater clarity before considering any adjustments to our policy stance.” 3
Indeed, there is a risk that Trump’s trade war could escalate before it is done, as is illustrated by China’s April 4th announcement of 34% retaliatory tariffs, and Trump’s threat to increase tariffs on China by an additional 50% “unless Beijing abandons its retaliatory duties on U.S. imports”. 4 It is also rumored that the European Union and Canada are planning to announce retaliatory tariffs against the U.S.
However, it is also quite possible that most tariffs will be negotiated away and prove to only be short term in nature, which would probably be the optimal outcome to the trade war. Indeed, according to Treasury Secretary Scott Bessent, “more than 50 countries had called the administration seeking negotiations, but any talks are going to take time”. 5 Further, Commerce Secretary Howard Lutnick recently told CBS News that “The tariffs are coming… They are definitely going to stay in place for days and weeks.” 6
That certainly suggests that the tariffs may only be a temporary bearish influence. In the meantime, the chaos created by President Trump’s tariff policy is catalyzing a decline in 10-year yields, a drop in oil prices and a weaker U.S. dollar, each of which President Trump has identified as goals.
Perhaps most importantly, markets are discounting mechanisms and thus normally discount most, if not all, of the bad news in advance of all of the bad news actually coming to fruition. Perhaps more accurately, markets tend to price into equity prices a worst-case scenario that usually turns out to be even worse than ultimately realized, which is one of the reasons why rallies off of bear market lows tend to be so powerful. Admittedly, at present, there is an unusually large amount of bad news that needs to be accounted for.
You almost never know until after the fact when the markets have experienced sufficient losses to suggest that the worst-case scenario is fully priced in. However, we cannot help but believe that we are probably getting close to that point. It will be important to monitor geopolitical events for potential progress on removing/reducing tariffs, as any decision by the administration to maintain tariffs at their current rates could have potentially calamitous implications.
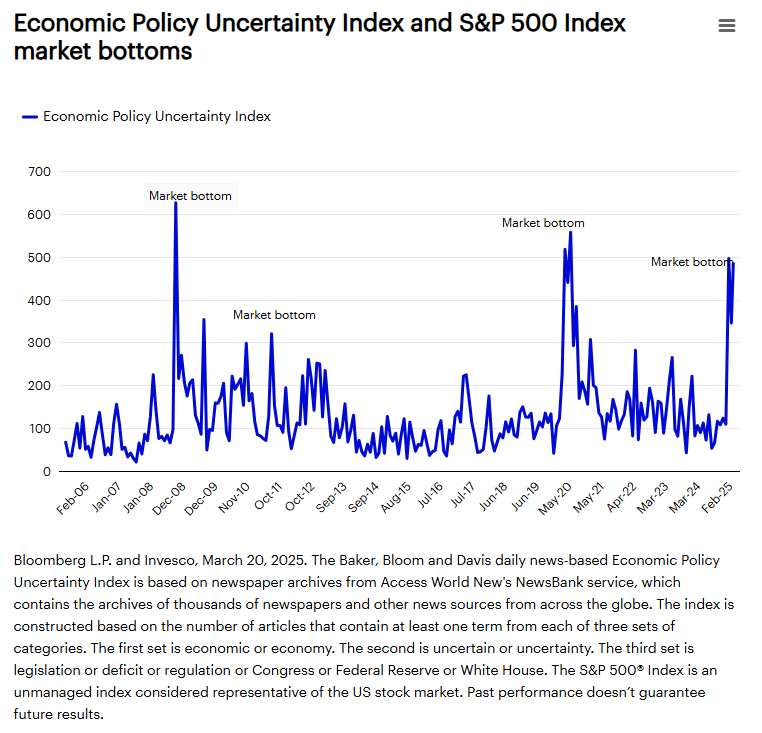
That said, we believe that it will be equally important to look for indications that the markets have already sufficiently priced in the worst of a worst-case scenario, which we would expect to allow the markets to rebound even as the political disruption continues. Indeed, one of the interesting historical relationships that we are monitoring (with the caveat that the past is not necessarily prologue) is the correlation between sharp increases in the level of policy uncertainty and the timing of bear market bottoms.
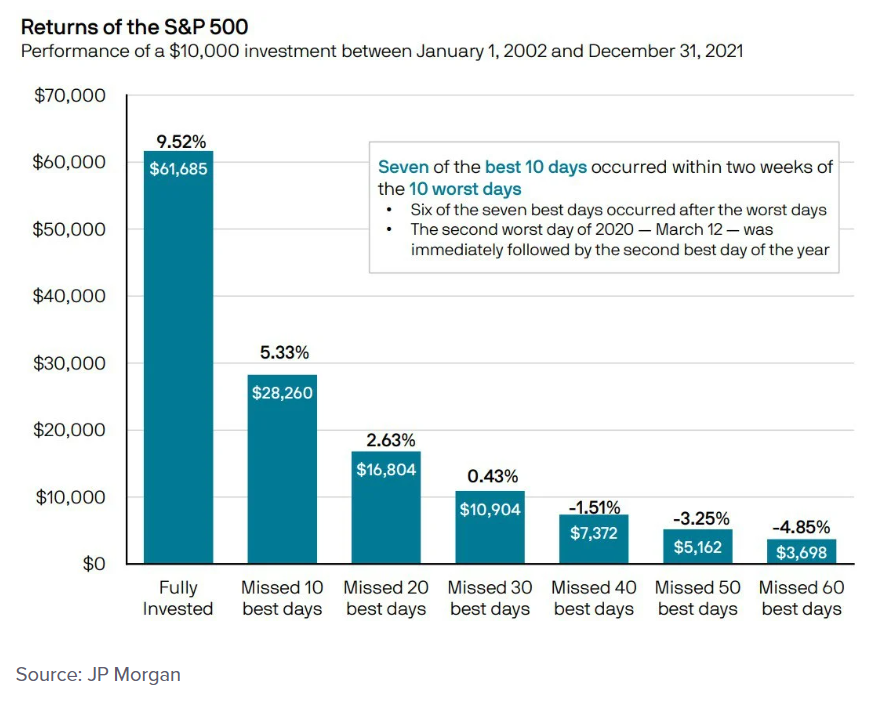
What to do in the midst of a sustained and substantial stock market decline is perhaps the single most difficult decision that an investor or portfolio manager is ever called upon to make, and it usually depends on the age and objectives of the investor. That said, two of the historical tendencies that should be considered are 1) that the largest daily advances in the stock market tend to occur soon after the days with the biggest declines and 2) that history suggests that if an equity investor misses those few big “up” days, it has historically had a dramatically negative impact on their portfolio returns.
We draw some comfort from the fact that some of Wall Street’s most respected analysts share our belief that we could be approaching an end to this violent decline (or at least the start of a bottoming process, as “V-shaped” bottoms are historically unusual in the domestic equity markets).
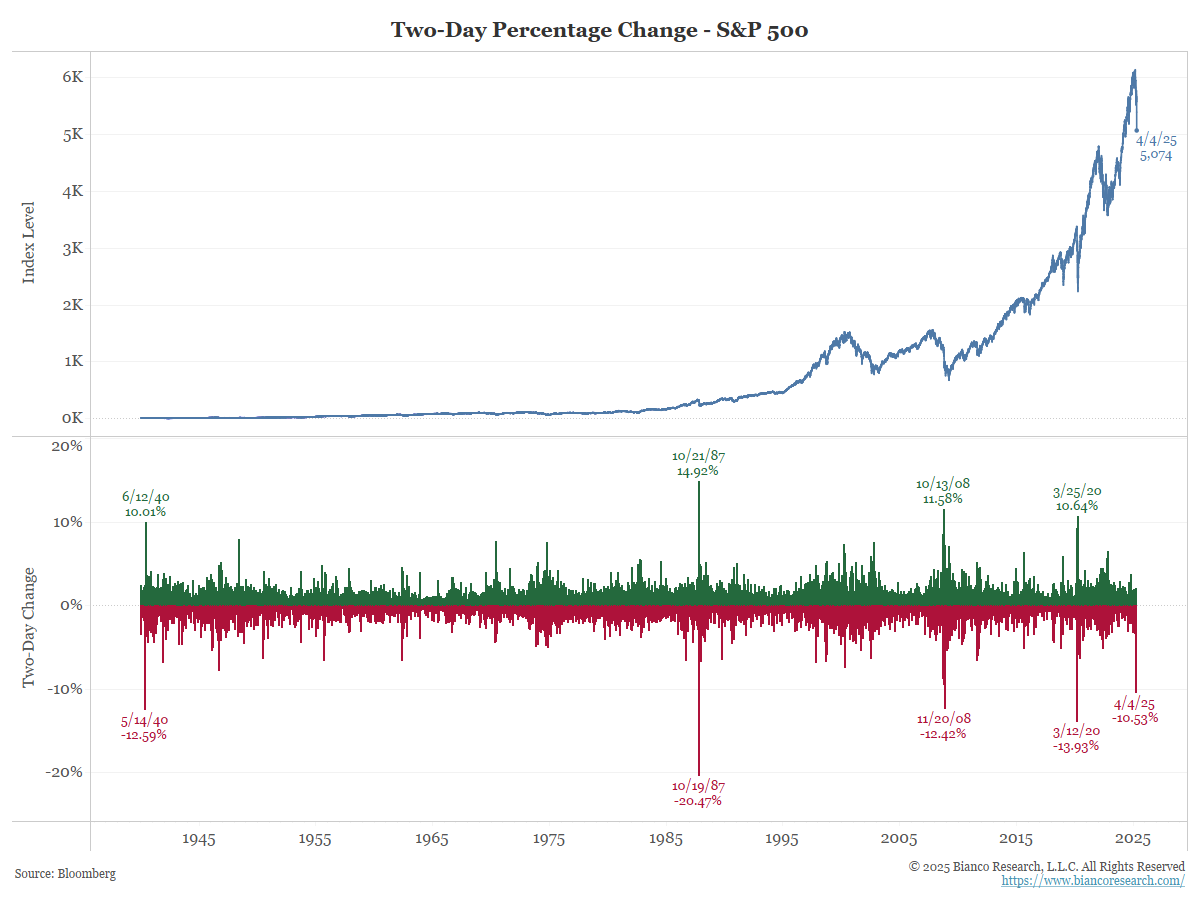
For example, on April 4th, Bespoke Investment Group wrote that, “After a decline of just under 5% on Thursday and a nearly 6% decline Friday, the S&P 500 lost over 10% of its value in just two days this week. Since the 5-trading day week started in late 1952, there have only been three other periods where the benchmark index of US stocks declined by double-digit percentages in just two sessions – October 1987, November 2008, and March 2020. Not all three of these periods marked absolute bottoms in the market, but they came very close to long-term lows. That doesn’t mean that this occurrence will end up being some fantastic buying opportunity, but it wouldn’t take much at this point to get the market to experience at least a short-term bounce.” 7
Similarly, BlackRock opined on the same date that, “In our view, the 10% baseline tariff for nearly all US imports is likely here to stay, while some of the higher country-specific rates could be used as leverage for negotiation. Although volatility is likely to persist for some time and risks of recession have risen, there are reasons to believe the odds of a full-blown trade war are limited and the current >15% market correction already reflects much of the negative impact to growth and earnings. Since we now have at least some clarity on the purported “ceiling” for tariffs and growing signs that retaliatory escalation may be less severe than anticipated, this week’s market turmoil could potentially represent the peak of trade policy uncertainty and anxiety.” 8
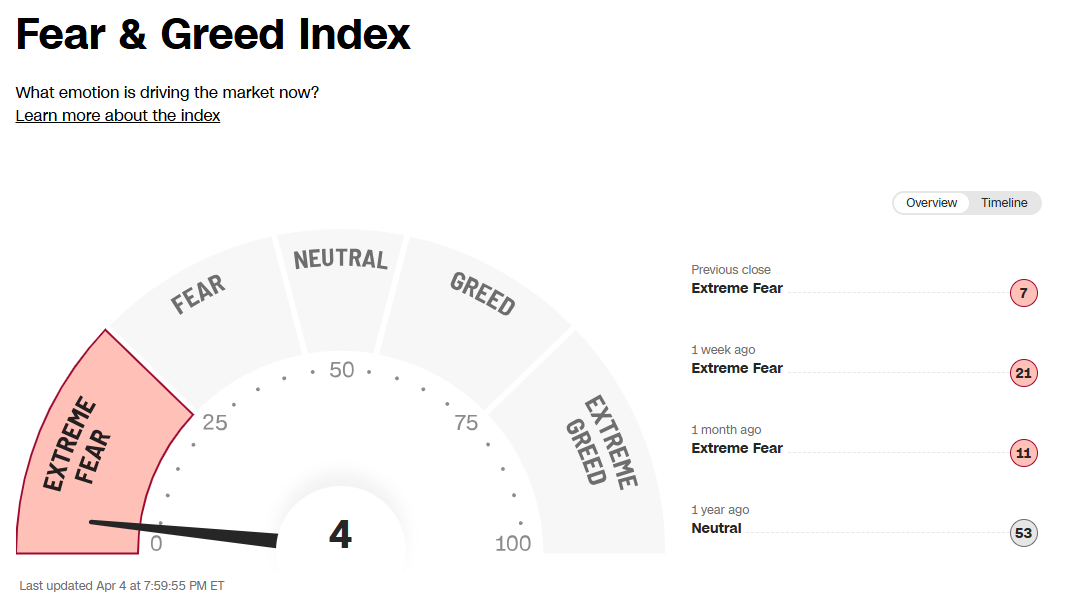
While, as renowned credit analyst Ed Hart was known for saying, “we are in a period when the demand for certainty far exceeds the available supply”, we also draw some comfort from signs of potential seller exhaustion like the preceding CNN Fear and Greed Index, which currently shows one of the highest levels of fear that we have ever seen in this gauge. 9
Such an extreme reading in this index, which measures investor risk appetite through an examination of 7 so-called “Fear & Greed” indicators including 1) stock market momentum, 2) stock price strength, 3) stock price breadth, 4) the put/call ratio (bearish options divided by bullish options), 5) stock market volatility, 6) the demand for “safe haven” assets (such as Treasury securities), and 7) the demand for non-investment grade “junk” bonds, suggests that the market may be running out of potential sellers.
For similar reasons, we draw some comfort from the fact that we just witnessed the largest decline in two years in the price of longer-term Treasury notes and bonds 10 as this “flight from safety” may be an indication of these extreme levels of fear starting to recede, which could allow the equity markets to rebound. For the time being, while we see reasons for hope, we believe that it is still too soon to have reasons for optimism.
While only time will tell if the equity markets are definitively at or even near a sustainable market bottom, we do believe that, with the benefit of hindsight, current equity prices will look quite compelling a year from now. We also believe that the second half of the year will be more friendly to equity markets, as we will hopefully be past much, if not all, of the tariff turmoil, the Fed will very likely be cutting interest rates, and the political agenda should shift towards more bullish policies, like tax cuts and deregulation.
We will close with some sage advice from legendary investor and former Director of Floor Operations for UBS, Art Cashin, who advised investors that, no matter how dire things may seem, “Don’t bet on the end of the world. You can only be right once.”
Disclosures
Advisory services offered through Per Stirling Capital Management, LLC. Securities offered through B. B. Graham & Co., Inc., member FINRA/SIPC. Per Stirling Capital Management, LLC, DBA Per Stirling Private Wealth and B. B. Graham & Co., Inc., are separate and otherwise unrelated companies.
This material represents an assessment of the market and economic environment at a specific point in time and is not intended to be a forecast of future events, or a guarantee of future results. Forward-looking statements are subject to certain risks and uncertainties. Actual results, performance, or achievements may differ materially from those expressed or implied. Information is based on data gathered from what we believe are reliable sources. It is not guaranteed as to accuracy, does not purport to be complete and is not intended to be used as a primary basis for investment decisions. It should also not be construed as advice meeting the particular investment needs of any investor.
Nothing contained herein is to be considered a solicitation, research material, an investment recommendation or advice of any kind. The information contained herein may contain information that is subject to change without notice. Any investments or strategies referenced herein do not take into account the investment objectives, financial situation or particular needs of any specific person. Product suitability must be independently determined for each individual investor.
This document may contain forward-looking statements based on Per Stirling Capital Management, LLC’s (hereafter PSCM) expectations and projections about the methods by which it expects to invest. Those statements are sometimes indicated by words such as “expects,” “believes,” “will” and similar expressions. In addition, any statements that refer to expectations, projections or characterizations of future events or circumstances, including any underlying assumptions, are forward-looking statements. Such statements are not guarantying future performance and are subject to certain risks, uncertainties and assumptions that are difficult to predict. Therefore, actual returns could differ materially and adversely from those expressed or implied in any forward-looking statements as a result of various factors. The views and opinions expressed in this article are those of the authors and do not necessarily reflect the views of PSCM’s Investment Advisor Representatives.
Past performance is no guarantee of future results. The investment return and principal value of an investment will fluctuate so that an investor’s shares, when redeemed, may be worth more or less than their original cost. Current performance may be lower or higher than the performance quoted.
Definitions
The Standard & Poor’s 500 (S&P 500) is a market-capitalization-weighted index of the 500 largest publicly-traded companies in the U.S with each stock’s weight in the index proportionate to its market. It is not an exact list of the top 500 U.S. companies by market capitalization because there are other criteria to be included in the index.
The VIX is a trademarked ticker symbol for the Chicago Board Options Exchange Market Volatility Index, a popular measure of the implied volatility of S&P 500 index options. Often referred to as the fear index or the fear gauge, it represents one measure of the market’s expectation of stock market volatility over the next 30-day period.
Indices are unmanaged and investors cannot invest directly in an index. Unless otherwise noted, performance of indices does not account for any fees, commissions or other expenses that would be incurred. Returns do not include reinvested dividends.
Citations
-
“JPMorgan Sees Global Recession Odds at 60% If Tariffs Sustained”, Matthew Boesler, Posted 4/3/2025, https://www.bloomberg.com/news/articles/2025-04-03/jpmorgan-sees-global-recession-odds-at-60-if-tariffs-sustained?sref=YfRIauRL
-
“Jerome Powell warns on Trump’s tariffs: High inflation could be here to stay”, Bryan Mena, Posted 4/4/2025, https://www.cnn.com/2025/04/04/economy/jerome-powell-fed-tariffs-jobs/index.html
-
“Powell Signals Fed Still on Hold, Wary of Persistent Price Shock”, Craig Torres, Amara Omeokwe, Posted 4/4/2025, https://www.bloomberg.com/news/articles/2025-04-04/powell-signals-fed-would-respond-to-persistent-inflation-shock?sref=YfRIauRL
-
“Trump threatens new 50% tariffs on China if Beijing doesn’t remove retaliatory duties: Live updates”, CNBC, Posted 4/7/2025, https://www.cnbc.com/2025/04/07/trump-tariffs-live-updates-stock-market-crypto.html
-
“Bessent Defiant on Tariffs as He Rejects a US Recession”, Shawn Donnan, Posted 4/6/2025, https://www.bloomberg.com/news/articles/2025-04-06/bessent-strikes-defiant-tariff-tone-as-he-rejects-us-recession?sref=YfRIauRL
-
“Dow slides more than 300 points as Trump tariffsrattle stocks for a third day: Live updates”, CNBC, Posted 4/7/2025, https://www.cnbc.com/2025/04/06/stock-market-today-live-updates.html
-
“The Bespoke Report”, Bespoke Investment Group, Posted 4/4/2025, https://www.bespokepremium.com/category/bespoke-report/
-
“Tariff-ied markets: 10% appears to be the rate of no return, but the worst uncertainty may be behind us”, Michael Gates, Tushar Yadava, Brett Wager, Posted 4/4/2025
-
“Fear & Greed Index”, CNN, As of 4/8/2025, https://www.cnn.com/markets/fear-and-greed
-
“Treasury Bonds Have Worst Selloff in 2Years as Stocks Stabilize”, Andrew Bary, Posted 4/7/2025, https://www.barrons.com/articles/treasury-bonds-selloff-stocks-13c54464