19
JanuaryPer Stirling Capital Outlook – January

When Franklin D. Roosevelt was inaugurated as President at the depth of the Great Depression, he offered the very reassuring perspective in his Inaugural Address that “the only thing to fear is fear itself”.
With the benefit of hindsight, that would also have been an extraordinarily insightful market commentary, if it had been offered at the start of 2023, when the level of investor pessimism was quite extraordinary. The consensus expectation was that inflation would remain high, that the world’s central banks would raise rates too far and too fast, and that such aggressively tight monetary policy would ultimately catalyze a global recession, or worse.
At the time, according to the January 2023 Bank of America Global Fund Manager Survey, portfolio managers were “a net 39% underweight (U.S. equities) in January, the largest month-on-month underweight change on record and the largest net underweight since October 2005. This compared to a net 12% underweight in December and a net 7% underweight in November.” 1
Further, according to that same survey, a net 33% of portfolio managers were underweight global equities 2, and a net 51% of managers said a recession was likely in the coming 12 months. 3 In contrast, there was considerable optimism about the Chinese economy, which was reopening its after its prolonged COVID shutdown. However, that optimism actually proved to be misplaced, as China turned out to have among the world’s weakest markets in 2023.
Bearish sentiment was high, investors were generally positioned in a very “risk-off” fashion, and Wall Street analysts were anticipating a very flat year, with average end of year estimates for the S&P 500 of 4,000, which turned out to be some 20% below the 4,800-level reached at year’s end.
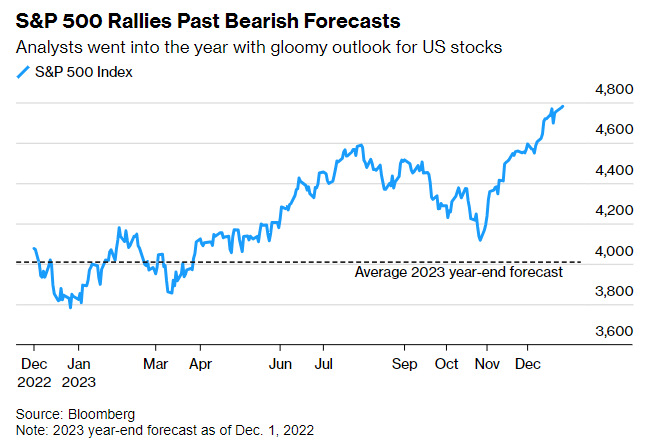
A year ago, investors were pricing in a very negative outcome, and needed to dramatically shift their portfolio allocations in response to a reality (falling inflation, a resilient economy, and a decreasingly hawkish Federal Reserve) that turned out to be much more bullish than almost anyone (ourselves included) had anticipated.
One year later, almost everything is on the opposite end of the spectrum, with very high levels of bullishness, expectations of a shift by the Fed from aggressive rate hikes to aggressive rate cuts, and growing confidence that inflation can be brought down to the Fed’s 2% target without pushing the economy into recession.
Indeed, in a sharp reversal from a year ago, it could be that the biggest impediment to an ongoing bull market, and the single biggest thing to fear, may ultimately be the “lack of fear itself”.
With investors now discounting a bullish scenario of falling inflation, an aggressive easing of monetary policy by the Fed, and a strong rebound in corporate profits, it presents a very high hurdle to clear for reality to again exceed investor expectations.
Put another way, markets are historically priced based upon current expectations, and tend to only make significant moves when reality turns out to be notably better or worse than expected. In the current environment, where so many optimistic expectations are already reflected in market prices, it may be a challenge for economic fundamentals to be so much better than current lofty expected that they drive the market prices substantially higher, at least over the immediate term.
For purposes of comparison, the December 2023 Bank of America Global Fund Manager Survey showed that portfolio managers are the most optimistic that they have been since January of 2022. According to the poll, “investors are the most overweight on stocks since before the Fed started to hike interest rates, with cash allocations cut to a two-year low of 4.5% from 4.7%.” 4
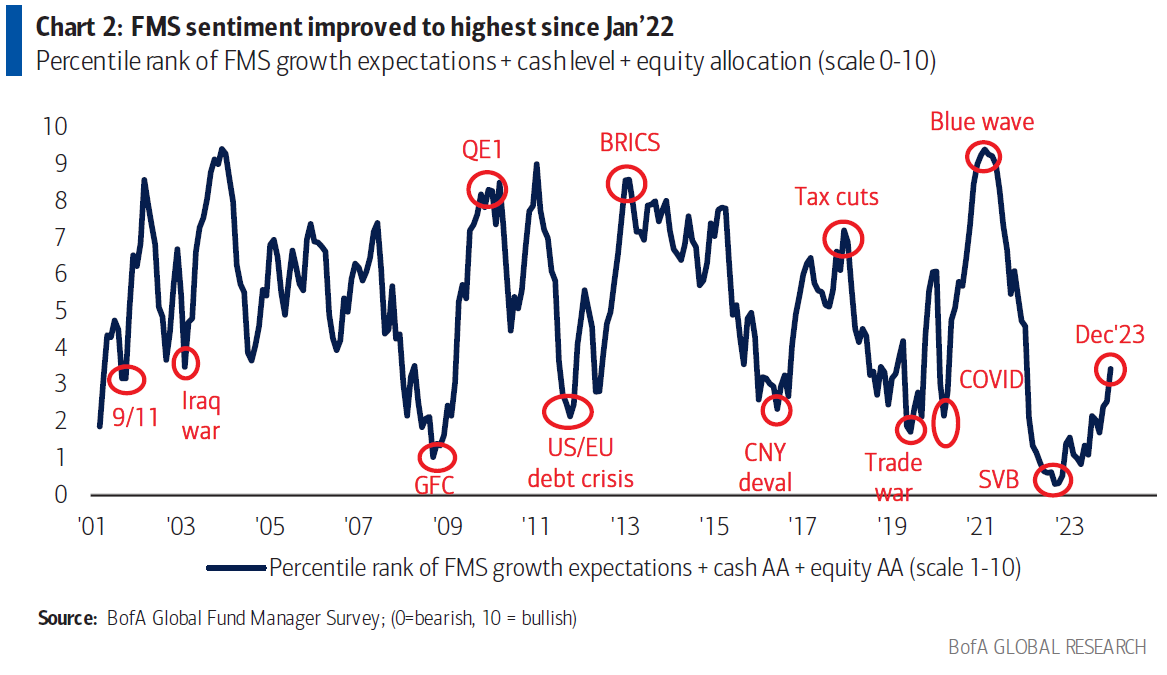
Of note, fund managers were also the most overweight bonds in 15 years, while being the most bearish on commodities relative to bonds since March 2009. Indeed, a net 91% of poll participants said that rate hikes from the Fed are over and that they expect to see lower interest rates across the yield curve. This reflects the most dovish sentiment seen since the start of the new millennium. 5
To be clear, our working premise is largely unchanged from what was laid out in our November commentary where we concluded by noting that “while there are still some reasons for caution in the intermediate term, the short and longer-term outlook for portfolio values is starting to look better than it has in years.”
This premise regarding the short term was based upon our perception that, at the time of that commentary, market sentiment was overly bearish, and most investors were underweight both stocks and bonds and overly exposed to cash. The longer-term optimism noted above was rooted in what we believe to be the very bullish longer-term implications of the Fed’s recent shift from hawkish guidance to dovish guidance.
Thus far, that perspective has proven rather prescient, as most financial assets have enjoyed a remarkable rally over the past two months (short term), and we remain quite optimistic (longer term), once the markets have the time necessary to both digest their recent gains and restore some level of healthy skepticism amongst investors.
Now that two months have passed, we find ourselves in what we had deemed in November as the “intermediate term”, where the perceived improvement in economic and market-related fundamentals is now so obvious that virtually everyone is aware of it, and it is thus already largely reflected in asset prices.
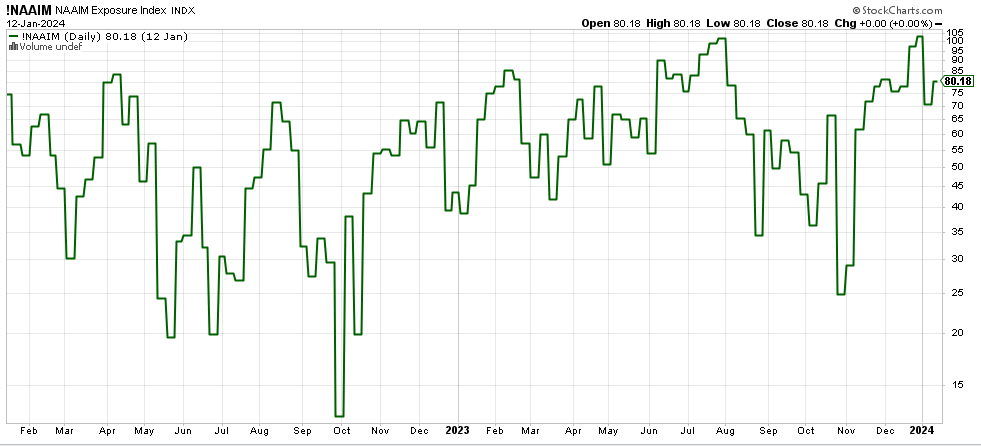
Indeed, on a very basic level, the markets face two short-term quandaries. The first has to do with investor positioning, and the fact that bullishness is so high that it appears there are relatively few bears left to be converted into bulls, which would bring new cash into the markets and theoretically drive prices higher. You can see this bullish positioning reflected in the below data from the National Association of Active Investment Managers (NAAIM), which shows that equity allocations are already near all-time highs.
Second, with so many optimistic expectations already priced into the markets, there is a much greater risk of information disappointing on the downside than it surprising to the upside.
This disappointment might include, as examples, interest rate cuts being less aggressive than currently expected or the geopolitical environment, which appears to be worsening by the day, continuing to deteriorate. While we believe that both are very legitimate concerns, the markets currently seem to be almost oblivious to those and most other potential risks.
Instead, the markets seem to be hampered by what is essentially “an abundance of riches”. The fundamental backdrop for financial assets has improved markedly, and asset prices have responded over recent months by rallying sharply. We believe that, as a result, there are too many people on the “bullish side of the boat”, and it is reflected in excessively bullish investor sentiment, elevated valuations on financial assets, and very bullish positioning, each of which suggests that, at least in the short term, the markets may be running low on the new investor dollars needed to drive prices higher.
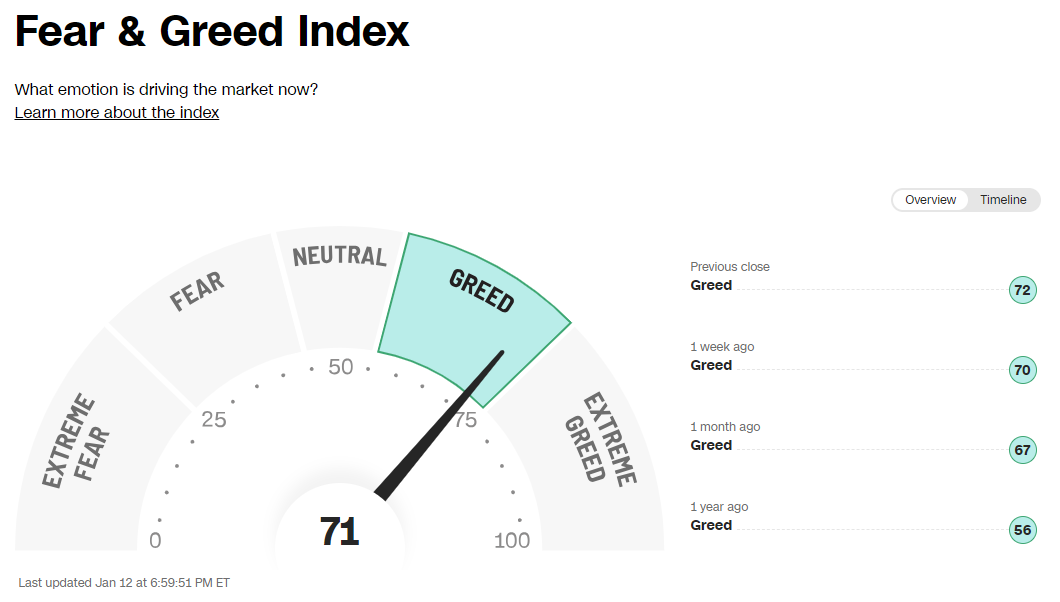
You can see this excessively bullish sentiment reflected in a variety of measures including the below CNN Fear and Greed Index 6, which uses a blend of seven market-based measures in an attempt to quantify the predominance of fear and/or greed amongst investors, and the American Association of Individual Investors (AAII) Sentiment Survey, which shows that the percentage of self-proclaimed bulls is more than 10% above the historic averages.
You can see this same kind of bullishness reflected in the measures of sentiment amongst investment newsletter writers, which can be quite telling, as each of the hundreds of investment newsletters can influence the opinions of the millions of investors who subscribe to them.
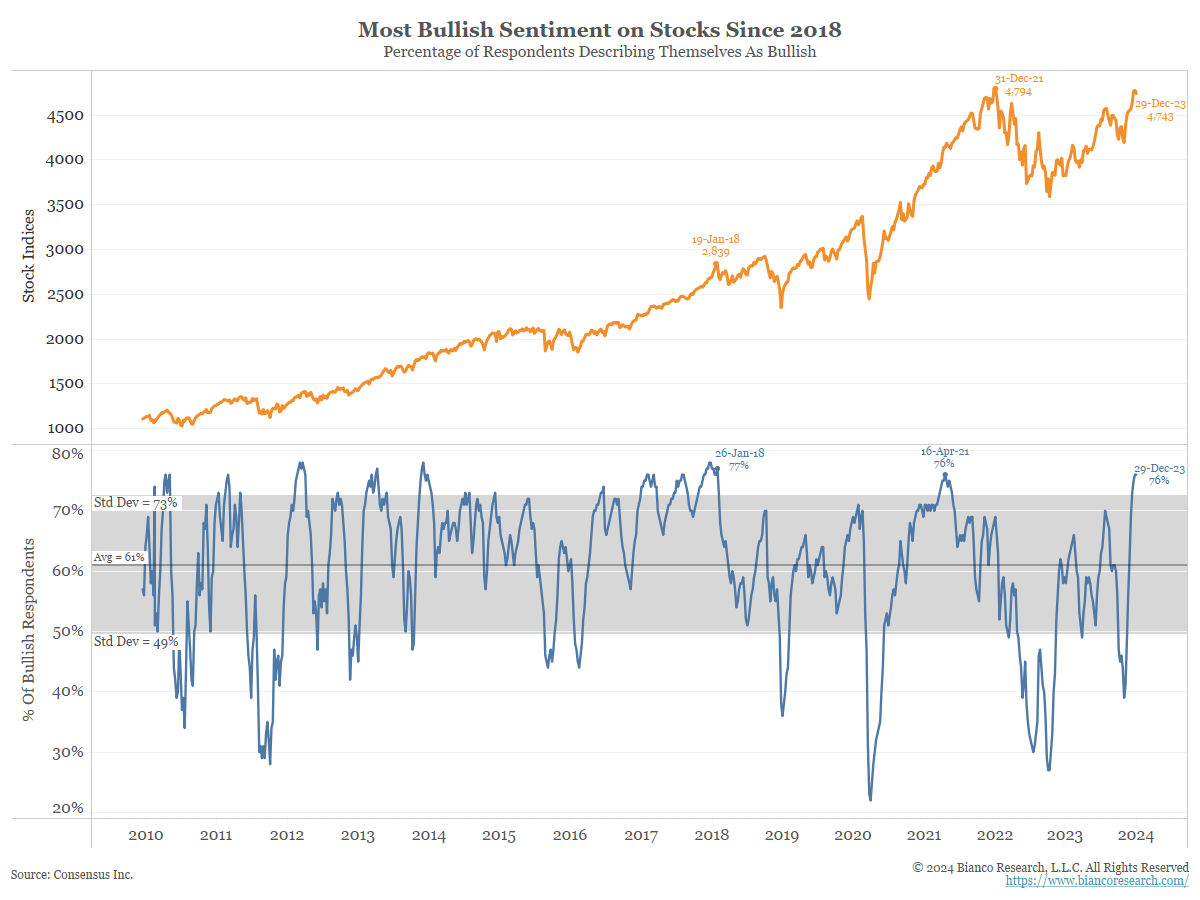
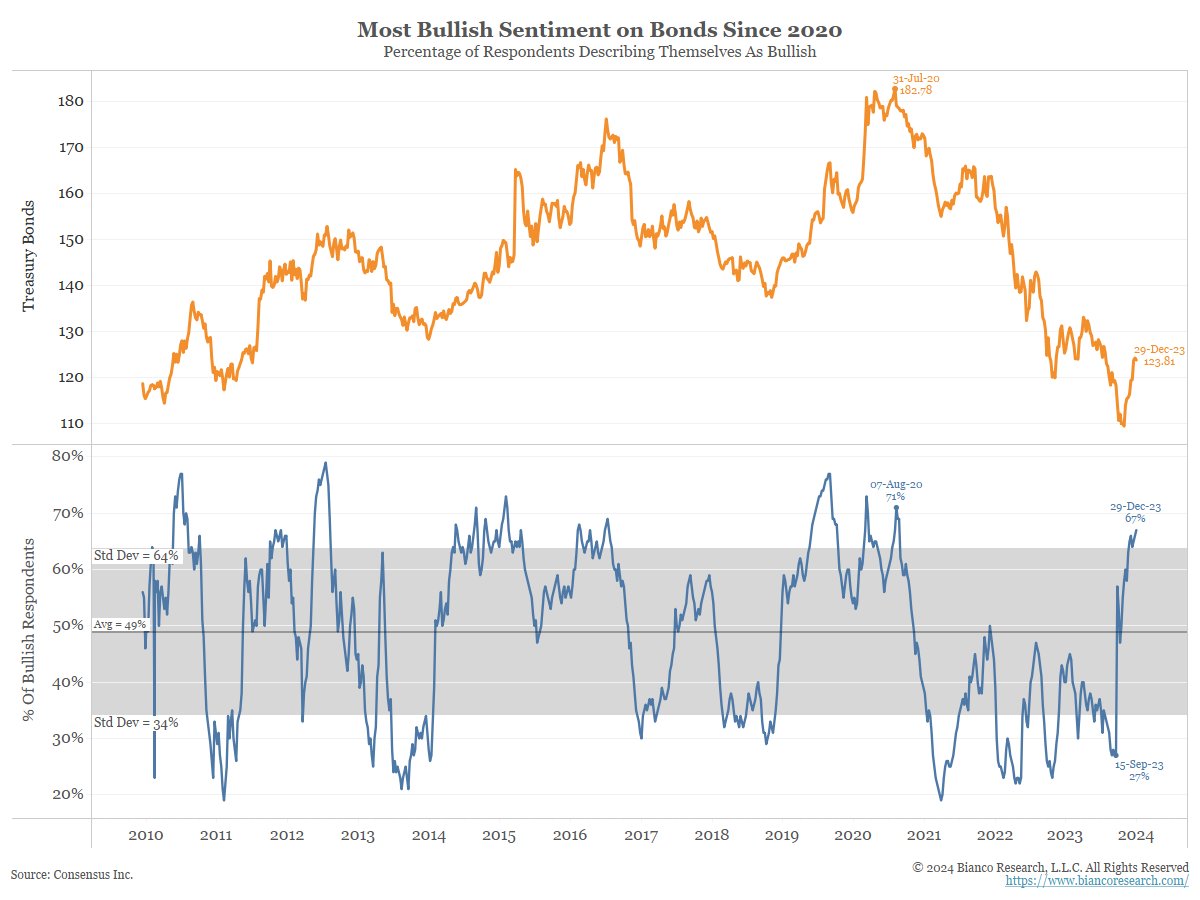
An analysis of these investment newsletters reveals the highest level of equity market bullishness since January of 2018 and, perhaps even more remarkably, the highest level of bond market bullishness since August of 2020.
There is another factor that we believe presents a different but related near-term impediment to an ongoing market advance, which is that these high levels of investor optimism and very bullish investor positioning have driven valuations for both stocks and bonds to arguably overvalued levels.
For example, with the 10-year Treasury note yield of 4% actually being equal to the level of the Core Consumer Price Index, it is hard to make that argument that the debt markets aren’t already quite expensive.
The same can be said of lower quality debt, where the risk premium (the difference between the yield of lower-quality debt and that of high-quality debt) of just over 3.5% is the tightest since April of 2022 7, which makes us question whether or not investors are being adequately compensated for the additional default risk that they are taking on when investing in higher-risk debt.
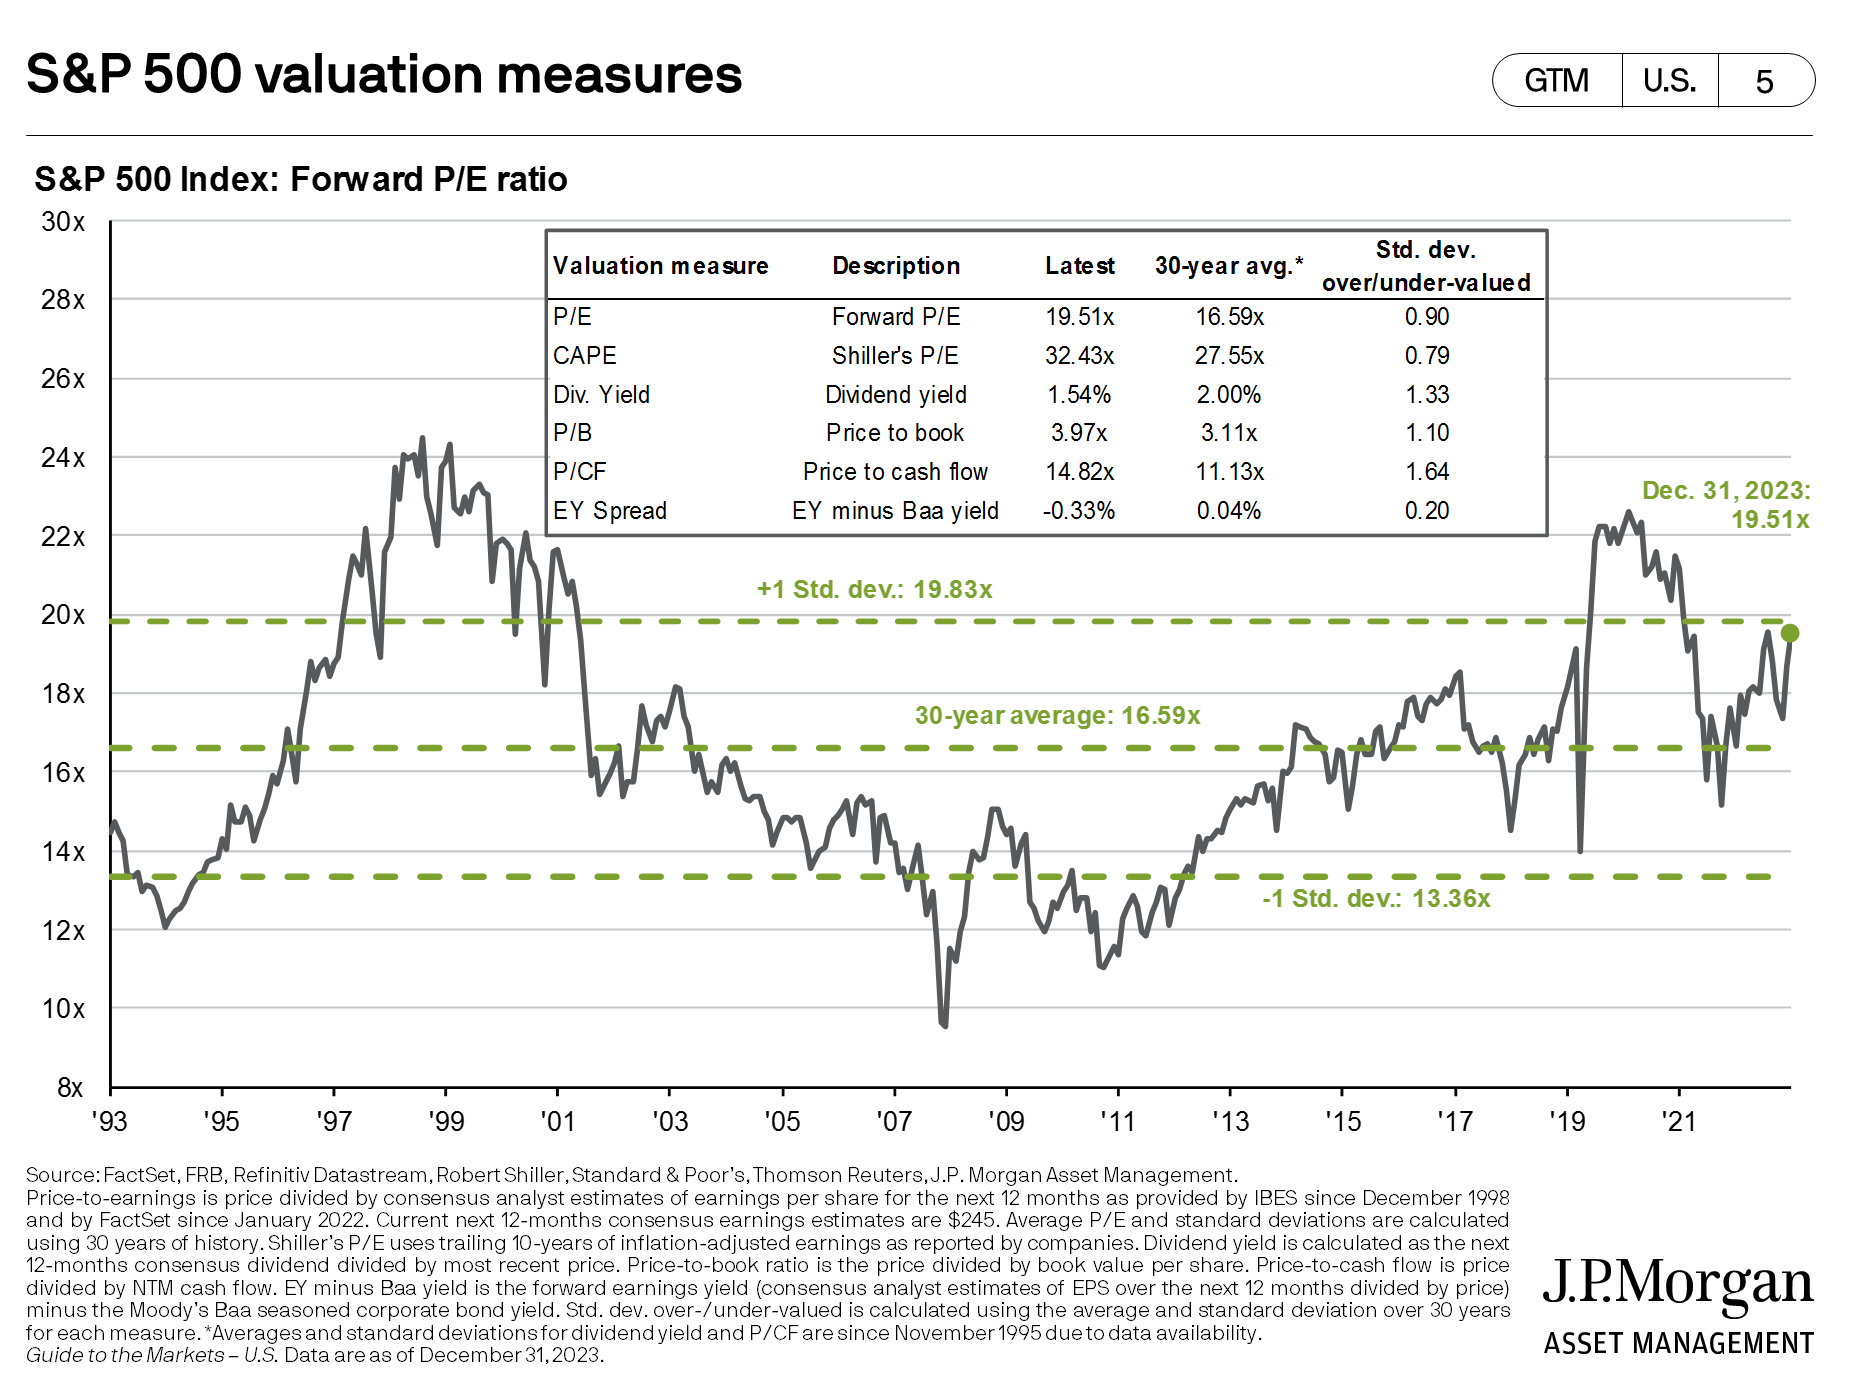
Moreover, we would argue that, at this point, the equity markets are even more highly valued than are the debt and credit markets. Indeed, with the current price-to-earnings multiple on the S&P 500 at a very lofty 21.57 times the next year’s anticipated earnings 8, equity valuations are 30% higher than the 16.59% valuation that they have averaged over the past thirty years.
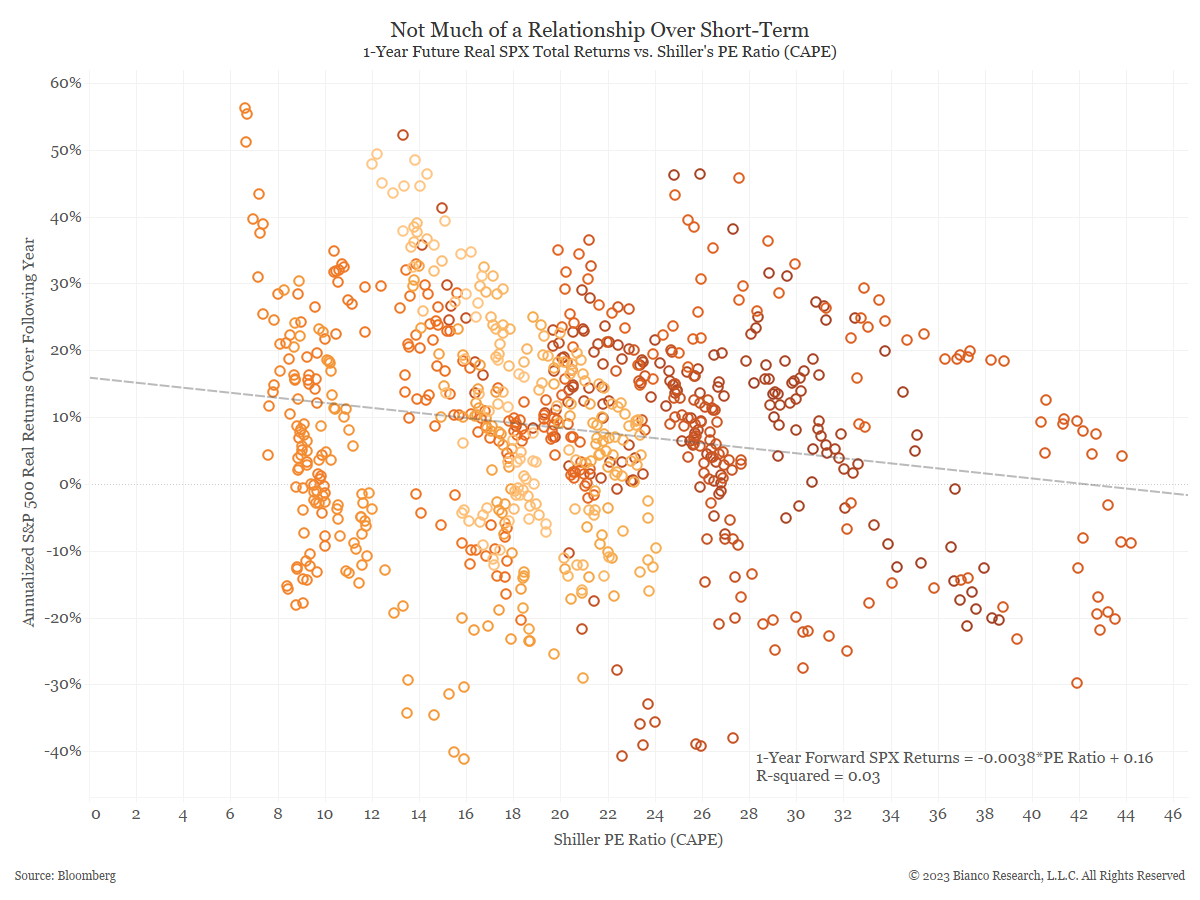
The “good” news about valuations is that, while they can tell you a great deal about both downside risks and longer-term upside potential, they tend to be terrible timing tools, at least historically.
Indeed, as you can see in the below scatterplot, there has historically been almost no short-term correlation between valuation and return. It is only over the longer term that valuations have historically had a statistically significant correlation with future returns. As such, we view today’s high valuations more as a short-term impediment to gains rather than as a reason to sell.
So, while this commentary has an admittedly cautious tone, it is not because we perceive the underpinnings behind stock and bond prices to be particularly negative. To the contrary, most market influences have become notably more bullish over recent months.
Further, our relative caution is predominantly short term in nature. Specifically, the near-term challenges are that this improvement in underlying fundamentals is so widely acknowledged that it is already largely discounted into the prices of securities, and that markets almost never go up (or down) on the same news twice.
From our perspective, the markets just need a new catalyst (one that is not already reflected in current prices) to fuel the next move higher, and we are confident that they will find one, which helps to explain why we remain quite bullish over the longer term.
However, whether that catalyst comes in the form of better-than expected corporate earnings, lower-than expected inflation and/or interest rates, a less contentious geopolitical environment, improving prospects for a bullish election outcome or something else entirely remains to be seen.
In the meantime, while the Fed is not yet providing a tailwind for the markets, they have at least ceased being a steadily strengthening headwind, and that change alone should help to keep markets fairly buoyant while investors await the new catalysts that will drive the next move higher.
Disclosures
Advisory services offered through Per Stirling Capital Management, LLC. Securities offered through B. B. Graham & Co., Inc., member FINRA/SIPC. Per Stirling Capital Management, LLC, DBA Per Stirling Private Wealth and B. B. Graham & Co., Inc., are separate and otherwise unrelated companies.
This material represents an assessment of the market and economic environment at a specific point in time and is not intended to be a forecast of future events, or a guarantee of future results. Forward-looking statements are subject to certain risks and uncertainties. Actual results, performance, or achievements may differ materially from those expressed or implied. Information is based on data gathered from what we believe are reliable sources. It is not guaranteed as to accuracy, does not purport to be complete and is not intended to be used as a primary basis for investment decisions. It should also not be construed as advice meeting the particular investment needs of any investor.
Nothing contained herein is to be considered a solicitation, research material, an investment recommendation or advice of any kind. The information contained herein may contain information that is subject to change without notice. Any investments or strategies referenced herein do not take into account the investment objectives, financial situation or particular needs of any specific person. Product suitability must be independently determined for each individual investor.
This document may contain forward-looking statements based on Per Stirling Capital Management, LLC’s (hereafter PSCM) expectations and projections about the methods by which it expects to invest. Those statements are sometimes indicated by words such as “expects,” “believes,” “will” and similar expressions. In addition, any statements that refer to expectations, projections or characterizations of future events or circumstances, including any underlying assumptions, are forward-looking statements. Such statements are not guarantying future performance and are subject to certain risks, uncertainties and assumptions that are difficult to predict. Therefore, actual returns could differ materially and adversely from those expressed or implied in any forward-looking statements as a result of various factors. The views and opinions expressed in this article are those of the authors and do not necessarily reflect the views of PSCM’s Investment Advisor Representatives.
Neither asset allocation nor diversification guarantee a profit or protect against a loss in a declining market. They are methods that can be used to help manage investment risk.
Past performance is no guarantee of future results. The investment return and principal value of an investment will fluctuate so that an investor’s shares, when redeemed, may be worth more or less than their original cost. Current performance may be lower or higher than the performance quoted.
Definitions
The Standard & Poor’s 500 (S&P 500) is a market-capitalization-weighted index of the 500 largest publicly-traded companies in the U.S with each stock’s weight in the index proportionate to its market. It is not an exact list of the top 500 U.S. companies by market capitalization because there are other criteria to be included in the index.
NAAIM Exposure Index represents the average exposure to US Equity markets reported by members of the National Association of Active Investment Managers.
Citations
-
“BofA Global Research Fund Manager Survey: US Equity Allocation Drops; Global Growth Concerns Fade Further in January”, Vicki Schmelzer, Posted 1/17/2024, https://macenews.com/bofa-global-research-fund-manager-survey-us-equity-allocation-drops-global-growth-concerns-fade-further-in-january/
-
“BofA Global Research Fund Manager Survey: US Equity Allocation Drops; Global Growth Concerns Fade Further in January”, Vicki Schmelzer, Posted 1/17/2024, https://macenews.com/bofa-global-research-fund-manager-survey-us-equity-allocation-drops-global-growth-concerns-fade-further-in-january/
-
“BofA Global Research Fund Manager Survey: US Equity Allocation Drops; Global Growth Concerns Fade Further in January”, Vicki Schmelzer, Posted 1/17/2024, https://macenews.com/bofa-global-research-fund-manager-survey-us-equity-allocation-drops-global-growth-concerns-fade-further-in-january/
-
“BofA Poll Shows Rate Cut Expectations Fueling Rush Into Stocks”, Farah Elbahrawy, Posted 12/9/2023, https://www.bloomberg.com/news/articles/2023-12-19/bofa-poll-shows-rate-cut-expectations-fueling-rush-into-stocks?sref=YfRIauRL
-
“BofA Poll Shows Rate Cut Expectations Fueling Rush Into Stocks”, Farah Elbahrawy, Posted 12/9/2023, https://www.bloomberg.com/news/articles/2023-12-19/bofa-poll-shows-rate-cut-expectations-fueling-rush-into-stocks?sref=YfRIauRL
-
“Fear & Greed Index”, CNN Business, As of 1/19/2024, https://www.cnn.com/markets/fear-and-greed
-
“The Weekly Fix: Fighting the Fed Actually Worked Out This Time”, Latie Greifeld, Posted 12/15/2023, https://www.bloomberg.com/news/newsletters/2023-12-15/the-weekly-fix-fighting-the-fed-actually-worked-out-this-time
-
“P/E Ratio” WSJ Markets, As of 1/12/2024, https://www.wsj.com/market-data/stocks/peyields
Images
-
“Portrait of President Franklin D. Roosevelt taken on June 20, 1936”, https://www.flickr.com/photos/fdrlibrary/32810560620