27
JunePer Stirling Capital Outlook – June

There is an old Wall Street expression that “bulls make money, bears make money and pigs get slaughtered”. Indeed, there are many animal-based analogies that are used to describe markets, investors and even investment styles, including “whales”, “sheep”, “lemmings” and even “herd mentalities”, just as examples.
For our part, we posit that the current domestic stock market is a “duck” market, as it looks very smooth, calm and peaceful on the surface, while its “feet” are churning frantically and even violently under the water.
So, just how placid does this year’s market look on the surface? To put it into perspective, thus far in 2024, there have only been seven days when the Standard & Poor’s 500 Index has fallen by as much as 1%, and there have been no daily declines of as much as 2%. There have been 14 days thus far this year with S&P 500 gains of at least 1% and one of at least 2%1, so volatility has been higher on the upside. However, that too is remarkably restrained, when you consider that the historic average daily move in the S&P 500 is around 0.5%, with an average 26% historical likelihood of a 1% or greater move (in either direction) on a daily basis.2
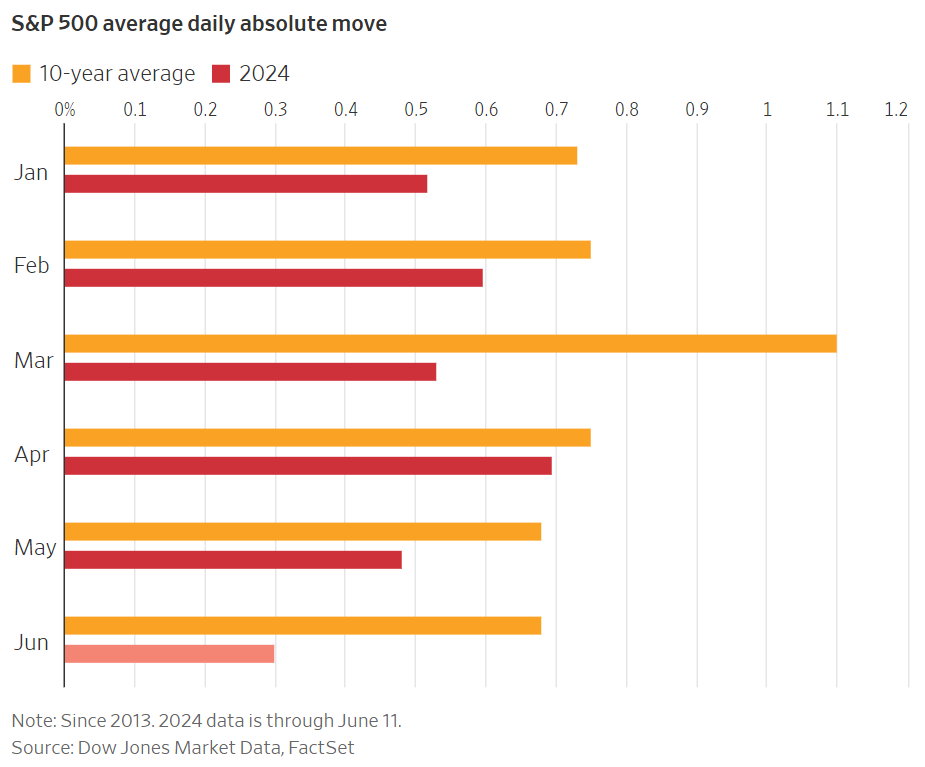
Indeed, as you can see reflected in the “absolute move” chart, the average daily volatility for the S&P 500 has been below the 10-year average for each and every month of 2024 to-date.
While daily volatility has (at least on the surface) remained quite low, most price movements on an index level have been to the upside, which explains the strong year-to-date returns being enjoyed by the large-capitalization, more growth stock-oriented equity indexes like the NASDAQ Composite and the Standard & Poor’s 500 Index.
However, the low-volatility bull market implied by these statistics is, to say the least, rather misleading, as the levels of both return and volatility change dramatically once you look beyond the bluest of the blue-chip growth stocks.
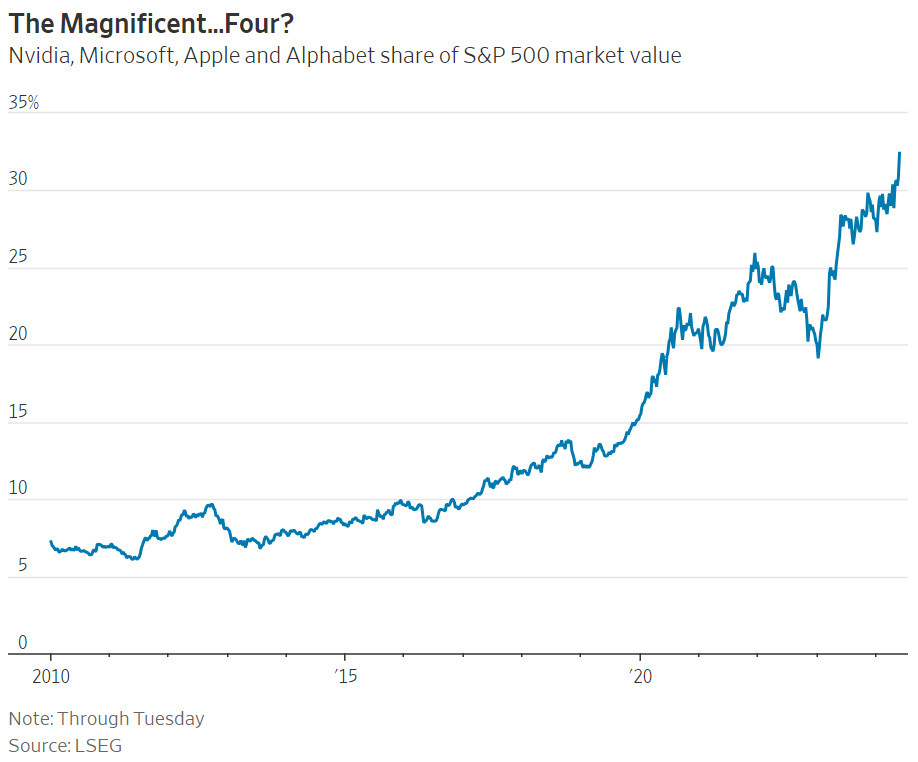
For example, whereas the capitalization-weighted S&P 500 Index, where Nvidia, Microsoft, Apple and Alphabet (Google) currently account for almost one-third of the price movement of the entire index, is up by around 15% year-to-date, the equal-weighted S&P 500 Index (which includes the same stocks, but in equal weightings) is up on the year by only around 4%.3
In other words, the average stock in this “blue-chip” index is up for the year by only around one-quarter as much as the index itself, which is due to the S&P’s heavy weighting to mega-cap growth stocks.
Indeed, once you look beyond the impact of these few mega-cap, growth stocks, the stock market looks much less like the tranquil duck sitting on top of the water and much more like the duck’s feet churning violently under the surface. The following data from Charles Schwab illustrates just how violent this churning beneath the surface has been.

This chart, which is current as of June 10th, shows impressive year-to-date gains for the S&P 500 (+12%) and NASDAQ (+15%), a modest 3% gain for the Dow Jones Industrial Average, and no gain for the Russell 2000 Index of small and mid-sized stocks. As is normally the case, each of these baskets of stocks did experience at least one pullback over the first half of the year, with the indexes declining from their year-to-date highs by between -5% to -9%.
While declines of that size are hardly immaterial, they mask the true level of volatility taking place on an individual stock basis (under the surface), with the average stock in each index declining between 14% and 15% in the case of the traditionally less volatile S&P 500 and Dow Jones Industrial Average, and between 28% and 39% in the case of the Russell 2000 and NASDAQ Composite. Note that these are declines from the year-to-date highs!
However, perhaps even more remarkable is the fact that, since the start of the current bull market on October 12, 2022 (a less-than-three-year period), the average stock in each of these indexes has declined by between 27% and 57%.
This very elevated, below-surface volatility is being masked by the dominating influence that six or seven mega-cap, technology-related stocks have on the major indexes, due to their massive market capitalization, and the fact that the stocks most heavily weighted in the indexes have also been among the year’s top performers.
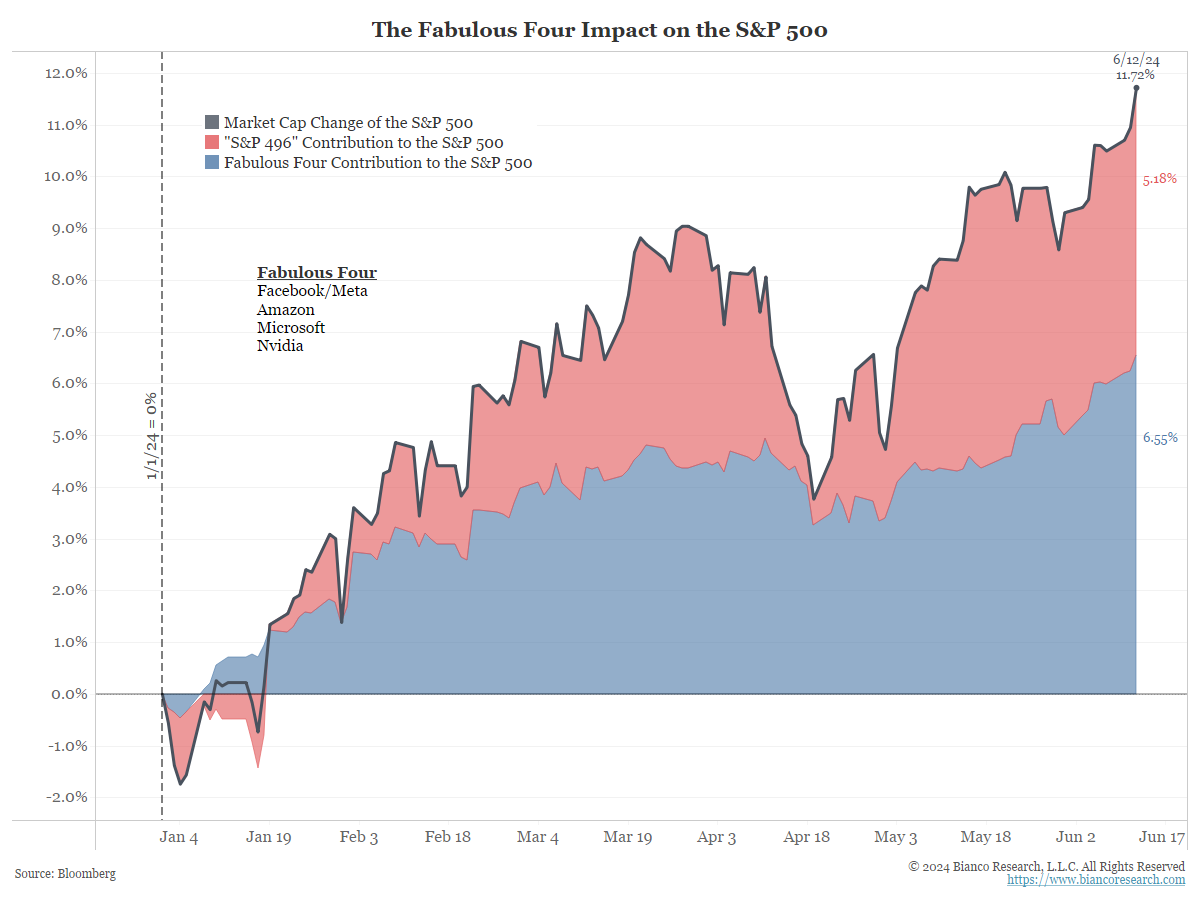
Indeed, more than half of the year-to-date gains for the entire S&P 500 Index have been produced by only four out of the 503 blue-chip stocks (of 500 companies included in the index).
One notable exception is the Dow Jones Industrial Average, where a stock’s weighting in the index is determined by the share price rather than market capitalization. It is also less heavily allocated to the technology sector compared to the S&P 500 and NASDAQ Composite. These two factors have largely caused the Dow Industrial Average to trade quite differently than its peers thus far in 2024.
As narrow as the market leadership has been throughout the year, it has become even more extreme in the second quarter, which has seen only a very limited number of stocks participate in the advance.

From the start of the quarter through June 18th, the stocks of the “Fab 5” companies (Nvidia, Microsoft, Amazon, Alphabet, and Meta) have gained over $1 trillion in value, the vast majority of which was attributable to Nvidia, which individually increased in value by over $1 trillion during the quarter. The stocks of the remaining 495 blue-chip companies included in the S&P 500 Index had a net quarter-to-date loss of around $600 billion in value.
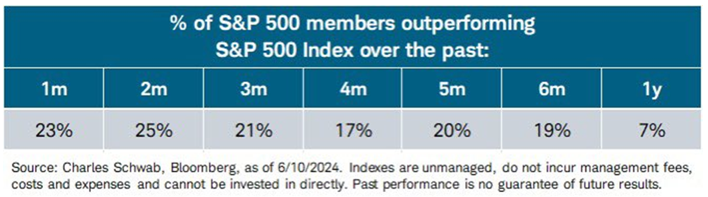
In fact, market breadth has been so poor over the past year that only 7% of stocks in the S&P 500 have managed to outperform the index itself, and cumulative returns over the past one through six months reveal no periods when more than a quarter of the stocks in the index have outperformed the index itself.
This exceptionally narrow breadth is not just limited by sector, although a significant majority of market gains have been concentrated in the technology sector. It is also limited by market capitalization.

To illustrate, if you take the S&P 500 and divide it into deciles (i.e., the largest 10%; then the second largest 10%, all of the way to the smallest 10%) you would see that, on a quarter-to-date basis, the only decile of the S&P 500 Index to avoid net losses was the largest 10%.4
 Forward price-to-earnings, as of 06/23/24
You can see these mega-cap winners represented by the largest boxes on the above S&P 500 “market map”.5 What this chart also illustrates is the dilemma faced by investors and portfolio managers alike. Specifically, the overwhelming impetus for higher prices in the domestic markets currently comes from the ultra-large, primarily technology-oriented companies, and the stocks of these companies, as represented by the forward price-to-earnings multiple illustrated in each box, are extraordinarily expensive (at least by historic standards).
While an imperfect benchmark, the average forward price-to-earnings multiple for the S&P 500 is around 18 times6, which means that it would take 18 years’ worth of next year’s expected earnings to equal the current share price. For Nvidia, it would take 35 years. For Amazon, it would take 32 years. For Apple, it would take 29 years and for Microsoft 34 years. While these are each very high-quality companies, they are also each very expensive by historical standards and, while that does not mean that they are destined to lose value, it is true that such expensive stocks are historically more susceptible to sharp declines.
So, what does history suggest about how such periods of narrow market breadth tend to resolve themselves, and how have narrow breadth markets traditionally performed compared to markets where the majority of stocks are participating on the upside?
With the obvious caveat that the past is not necessarily prologue, such periods of very narrow market leadership are rather rare, but they obviously do occur, and can be surprisingly sustainable.
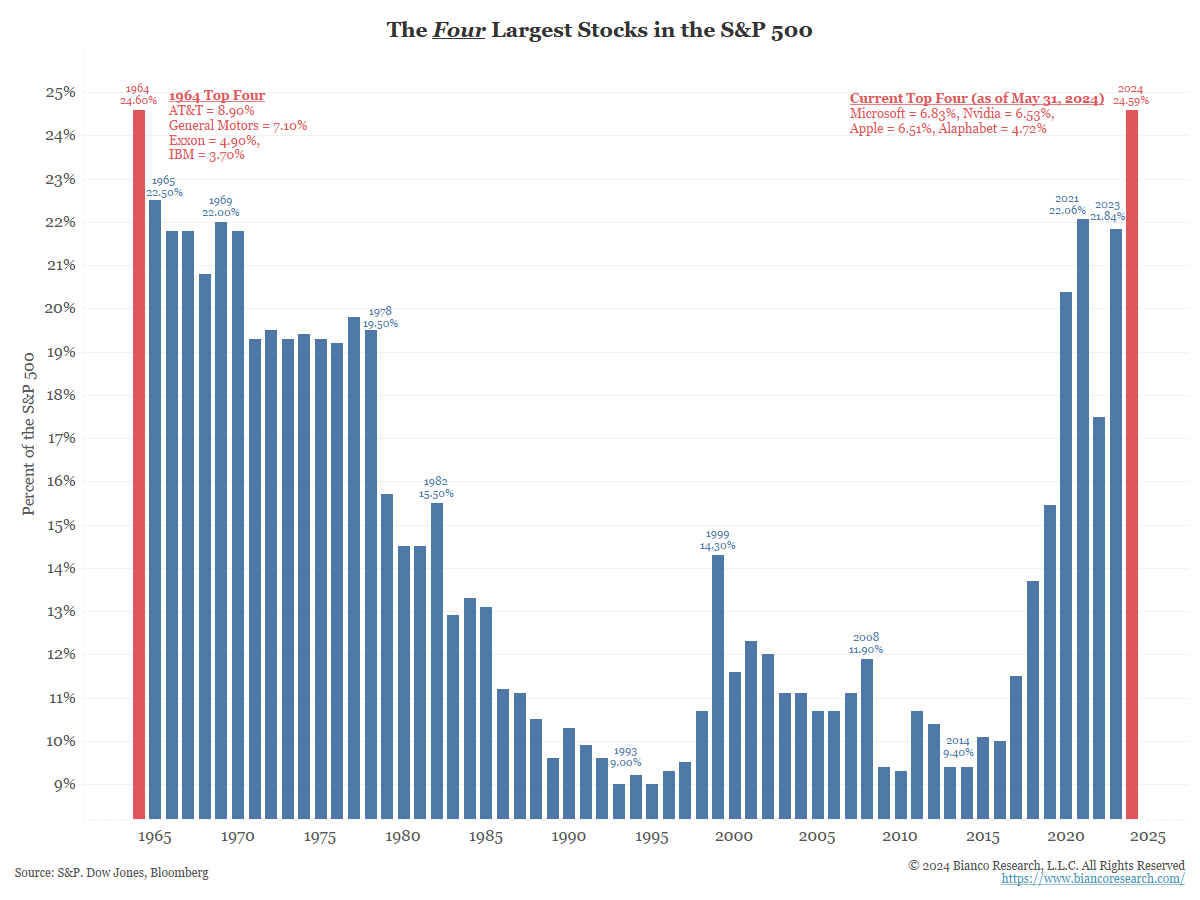
The best comparison to the current environment is arguably the “Nifty-Fifty” market of the late 1960s to the early 1970s. This period is associated with a group of about fifty large-cap, “blue-chip” stocks that powered the market until the 1973-1974 market crash and the resulting bear market that lasted until 1982.
Arguably, we witnessed a partially comparable period in the late 1990s and in early 2000 in that, as is the case today, the market was powered overwhelmingly by technology stocks, due to the adoption of a new technology (at that time, the internet) and a requisite global technology upgrade in anticipation of potential Y2K-related problems.
However, that was a much more speculative market, where the stocks of non-profitable companies outpaced those of profitable companies; when many stocks were valued based on how many “clicks” a website had received, and billions of dollars could be added to a company’s value by simply adding “.com” to their name. By contrast, the stocks that have led this bull market are among the highest quality companies in the world with rapid earnings growth, strong free cash flow and pristine balance sheets.
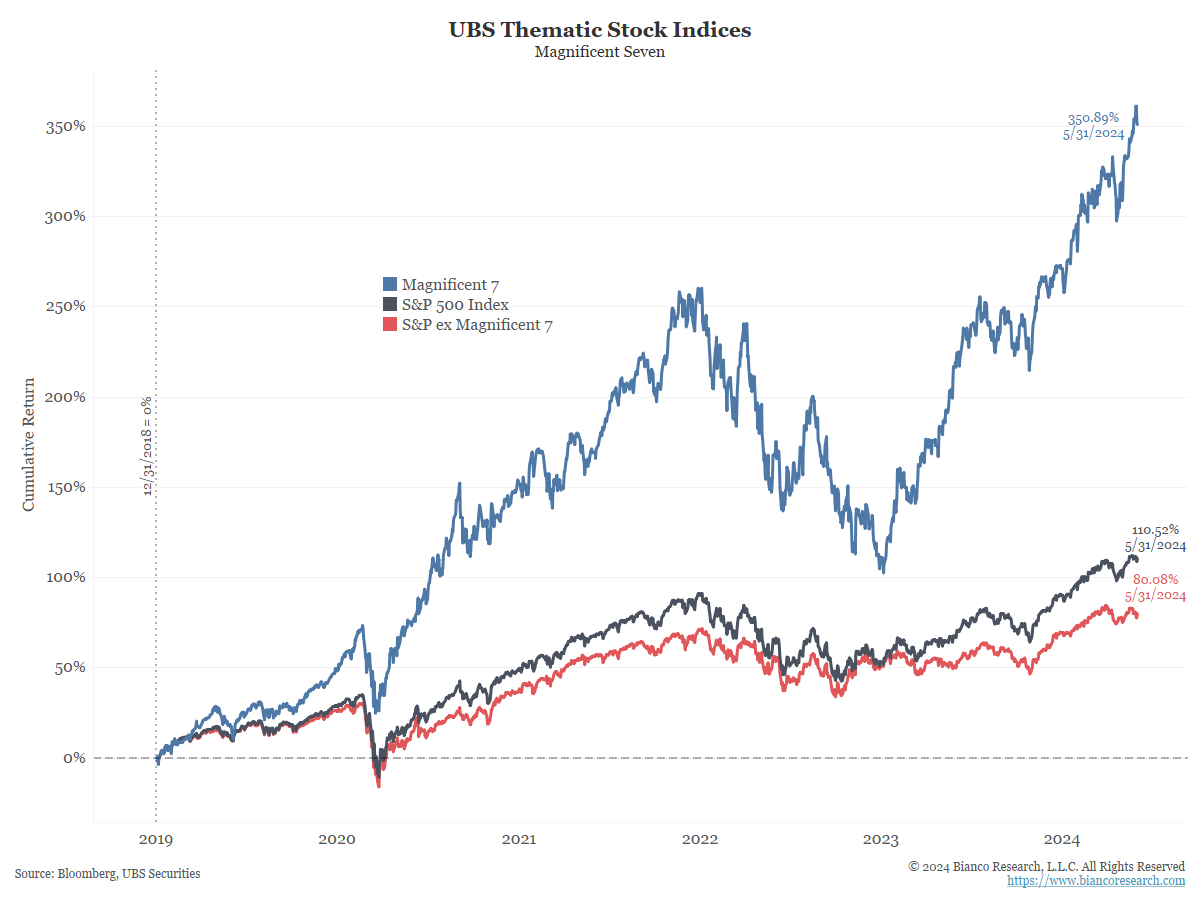
As noted, the current highly concentrated bull market has been powered primarily by the so-called “Magnificent 7” stocks (including Amazon, Apple, Alphabet (Google), Meta Platforms (Facebook), Microsoft, Nvidia, and Tesla), which have actually been the primary drivers of the broad market over most of the past five-plus years.
While such narrow markets can persist for extended periods, there are times (perhaps like the present) when the extent of both the poor market breadth and the vast outperformance of the leading stocks reach potentially unsustainable extremes.
To illustrate this concept, we have included this ratio chart that divides the capitalization-weighted S&P 500 (where the most valuable companies have the greatest influence on the performance of the index) by the equal-weighted S&P 500 (which includes the same 500 companies, but where each of them has an equal influence on the performance of the index). When the price-line is rising, the biggest, most valuable stocks are outperforming and, the steeper the line, the more extreme the level of outperformance.
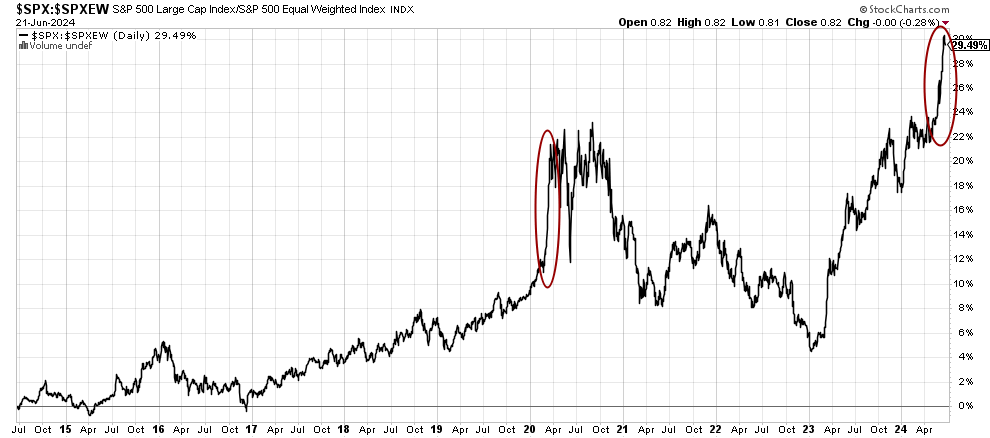
We saw a similar “parabolic’ move in relative mega-cap growth performance (red circles above) in the year 2020, when the Fed first started buying assets and injecting liquidity to help protect the economy from the impact of the COVID pandemic. As is often the case, the parabolic move in 2020 proved unsustainable and resulted in a multi-year broadening out of the stock market to include smaller, more cyclical, and more value-oriented stocks.
How the current parabolic move resolves itself remains to be seen, but we suspect that it will result in some significant change in the markets, whether it be a change in leadership, a broadening out of the market beyond today’s very narrow leadership (hopefully), a reversal in market trend, or something else entirely.
Only time will tell how the anticipated change in market characteristics will evolve, or if the status quo simply continues.

In the meantime, we take some comfort from the results of a very surprising research piece from FactSet and Counterpoint Global, which shows that, contrary to Bob Farrell’s broadly accepted rule that “markets are strongest when they are broad and weakest when they narrow to a handful of blue-chip names”, increasingly concentrated markets and those with narrower leadership have historically actually produced superior returns. On the other hand, we think that a market with strong breadth actually promotes higher risk-adjusted returns, as it is clearly easier for both managers and individual investors to select “winning stocks” when the majority of stocks are moving higher.
Disclosures
Advisory services offered through Per Stirling Capital Management, LLC. Securities offered through B. B. Graham & Co., Inc., member FINRA/SIPC. Per Stirling Capital Management, LLC, DBA Per Stirling Private Wealth and B. B. Graham & Co., Inc., are separate and otherwise unrelated companies.
This material represents an assessment of the market and economic environment at a specific point in time and is not intended to be a forecast of future events, or a guarantee of future results. Forward-looking statements are subject to certain risks and uncertainties. Actual results, performance, or achievements may differ materially from those expressed or implied. Information is based on data gathered from what we believe are reliable sources. It is not guaranteed as to accuracy, does not purport to be complete and is not intended to be used as a primary basis for investment decisions. It should also not be construed as advice meeting the particular investment needs of any investor.
Nothing contained herein is to be considered a solicitation, research material, an investment recommendation or advice of any kind. The information contained herein may contain information that is subject to change without notice. Any investments or strategies referenced herein do not take into account the investment objectives, financial situation or particular needs of any specific person. Product suitability must be independently determined for each individual investor.
This document may contain forward-looking statements based on Per Stirling Capital Management, LLC’s (hereafter PSCM) expectations and projections about the methods by which it expects to invest. Those statements are sometimes indicated by words such as “expects,” “believes,” “will” and similar expressions. In addition, any statements that refer to expectations, projections or characterizations of future events or circumstances, including any underlying assumptions, are forward-looking statements. Such statements are not guarantying future performance and are subject to certain risks, uncertainties and assumptions that are difficult to predict. Therefore, actual returns could differ materially and adversely from those expressed or implied in any forward-looking statements as a result of various factors. The views and opinions expressed in this article are those of the authors and do not necessarily reflect the views of PSCM’s Investment Advisor Representatives.
Neither asset allocation nor diversification guarantee a profit or protect against a loss in a declining market. They are methods that can be used to help manage investment risk.
Past performance is no guarantee of future results. The investment return and principal value of an investment will fluctuate so that an investor’s shares, when redeemed, may be worth more or less than their original cost. Current performance may be lower or higher than the performance quoted.
Definitions
The Standard & Poor’s 500 (S&P 500) is a market-capitalization-weighted index of the 500 largest publicly-traded companies in the U.S with each stock’s weight in the index proportionate to its market. It is not an exact list of the top 500 U.S. companies by market capitalization because there are other criteria to be included in the index.
The Nasdaq Composite index tracks the performance of about 3,000 stocks traded on the Nasdaq exchange. It’s mainly used as an indicator of how well companies in the tech sector – both large and small – are doing
The Russell 2000 Index measures the performance of approximately 2,000 small-cap companies in the Russell 3000 Index, which is made up of 3,000 of the biggest U.S. stocks. The Russell 2000 serves as a benchmark for small-cap stocks in the United States.
Dow Jones Industrial Average is a price-weighted average of 30 actively traded blue-chip stocks, primarily industrials including stocks that trade on the New York Stock Exchange. The Dow, as it is called, is a barometer of how shares of the largest US companies are performing.
Citations
-
“Quick Comments/What We’re Reading”, Greg Blaha, Posted 6/17/2024, https://www.biancoresearch.com/quick-comments-what-were-reading-1380/
-
“Probability of Significant Market Move”, Kai Zeng, Posted 2/26/2024, https://www.tastylive.com/news-insights/understanding-significant-market-moves-risks-opportunities#:~:text=Historically%2C%20the%20S%26P%20500%20has,%C2%B10.5%25%20in%20either%20direction.
-
“S&P 500 Equal Weight Index”, S&P Dow Jones Indices, As of 6/23/2024, https://www.spglobal.com/spdji/en/indices/equity/sp-500-equal-weight-index/#overview
-
“Chart of the Day – It’s the Market Cap, Stupid”, Bespoke Investment Group, Posted 6/10/2024, https://www.bespokepremium.com/institutional-logged-in/page/3/?et_blog
-
“Standard and Poor’s 500 index stocks categorized by sectors and industries.”, finviz, As of 6/23/2024, https://finviz.com/map.ashx?st=fpe
-
“Characteristics of an Asset Bubble”, Alex Malltas, Posted 6/14/2024, https://www.biancoresearch.com/characteristics-of-an-asset-bubble/