30
AprilPer Stirling Capital Outlook – April

Too much of a good thing…
In the oftentimes-counterintuitive world of financial markets, the way that investors respond to fundamental data may sometimes seem nonsensical. Indeed, market history is filled with periods when “good” news is received by investors as “bad” (bearish) news and “bad” news is perceived by the markets as “good” (bullish) news.
For example, in an environment where inflation is undesirably high, markets might celebrate a slowing economy and rising unemployment (“bad news”) as “good” news, as higher unemployment and a slowing economy should lead to lower inflation and lower interest rates, which is normally “good” (bullish) news for the markets.
We believe that this is exactly the perspective that has prevailed since the “Fed pivot” late last year, when Fed Chairman Powell’s forward guidance abruptly shifted from the economy being too strong; inflation remaining too high and interest rates needing to stay higher for longer, to expectations for a non-recessionary economic “soft landing”, with inflation returning to the Fed’s 2% target, a modest uptick in unemployment and the Fed responding by lowering interest rates three times in 2024.
At that point, “bad” news became “good” news from most investors’ perspective, as it increased the likelihood of the Fed cutting rates both sooner and more frequently than previously expected.
That dynamic has not changed. However, what is different is the macroeconomic environment itself, where the outlook has changed from being modestly “bad” to remarkably “good”, and such a substantial upgrade is causing investors to question whether the fundamental backdrop is, in fact, so good (i.e., bad) that it will keep the Fed from lowering interest rates altogether or, at minimum, substantially limit the number of potential rate cuts.
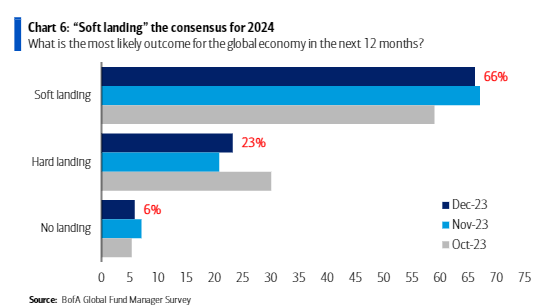
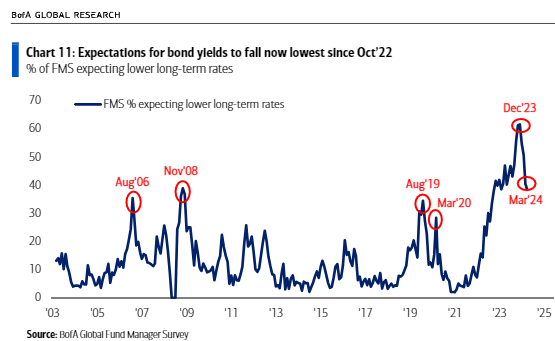
As recently as last December, there was a broadly accepted expectation that the U.S. economy would slow down just enough to allow inflation to continue falling towards the Fed’s 2% target, but not slow by so much that it actually slipped into recession. Market expectations for such an economic “soft landing” were reflected in the December 2023 Bank of America Global Fund Manager Survey (above), which showed that a remarkable 66% of polled portfolio managers anticipated such a “goldilocks” outcome.
Equally noteworthy is that only 6% of polled fund managers thought that the economy would avoid a slowdown altogether, even though such a “no landing” scenario currently looks like the most probable outcome.
Those previous expectations of slowing but sustainable growth, falling inflation, strong corporate profits, and expectations for the Federal Reserve to start an aggressive interest rate-cutting campaign early in 2024 was perceived as market nirvana, which was reflected in the first quarter’s impressive equity returns.
The S&P 500’s 10.2% gain represented its biggest first-quarter gain since 2019 and its first record high in two years, while the technology stock-heavy NASDAQ Composite (up by 9.1% for the quarter) hit its first record high since November of 2021 and the Dow Jones Industrial Average’s 5.6% quarterly gain represented its strongest first-quarter performance since 2021. 1
Underlying this surge in bullishness was the belief that inflation would make steady progress back towards the Federal Reserve’s 2% target, and that such progress would catalyze the Fed to aggressively cut interest rates.
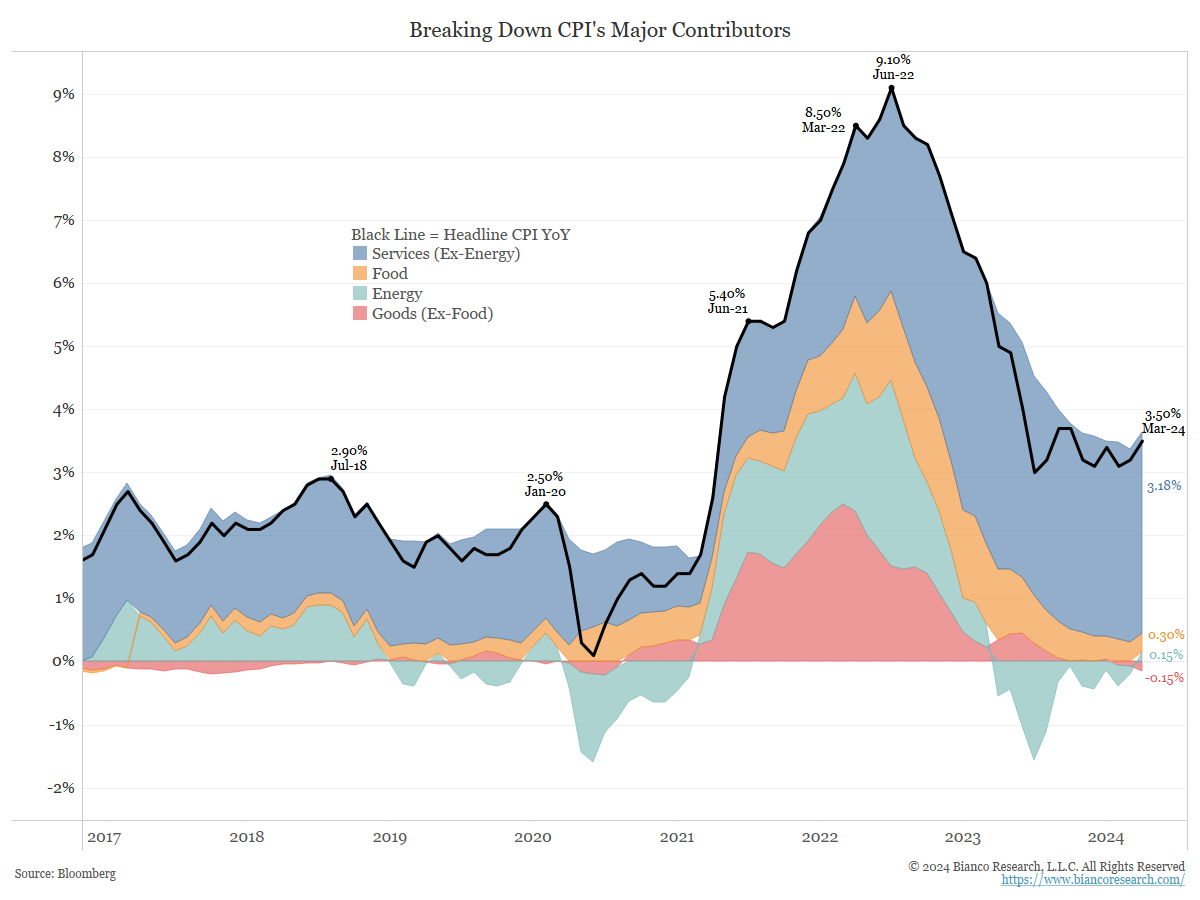
However, for the time being, that optimistic expectation has been put on hold, as the Fed’s progress on battling inflation has not only stalled, but is showing signs of reversal, particularly in the all-important “services” sector, which is dominated by shelter-related costs (see the above CPI chart).
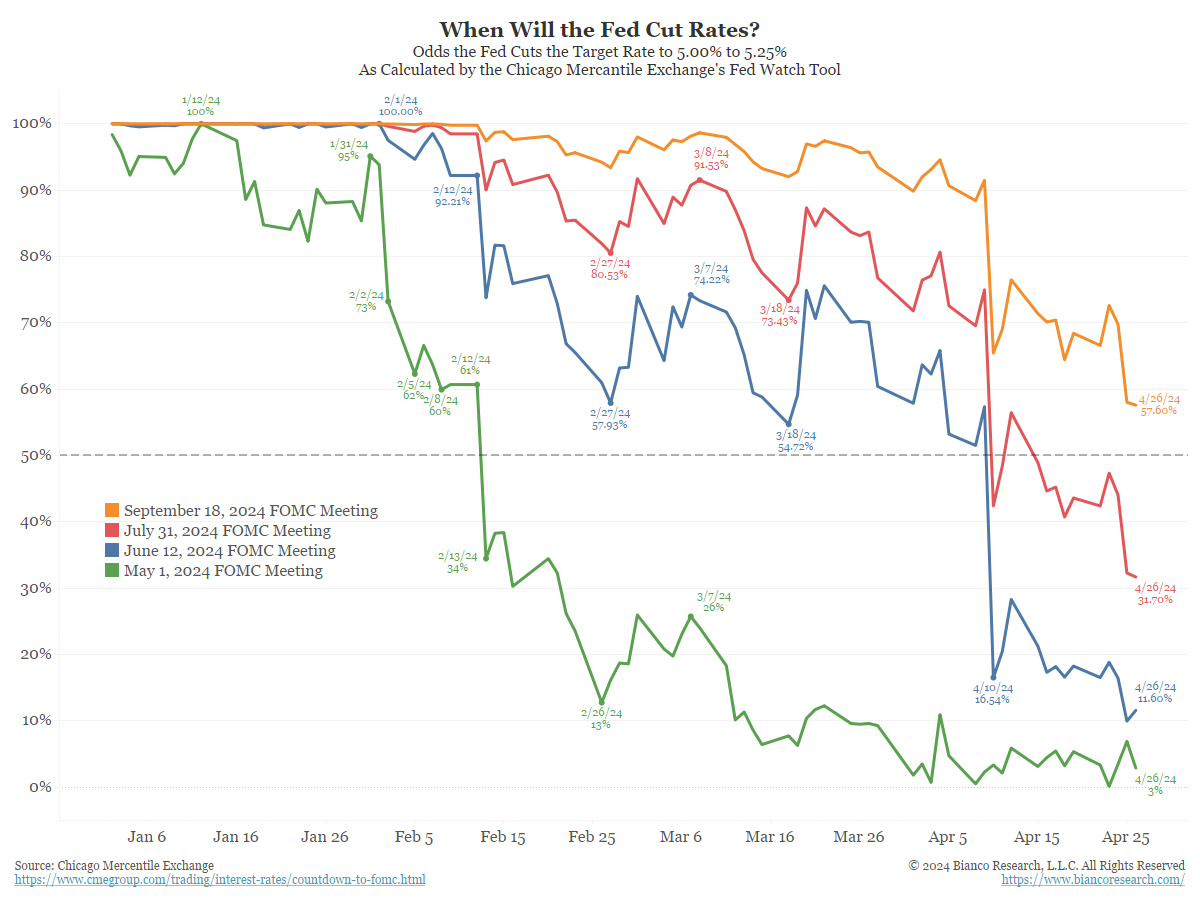
You can see this reflected in the Fed Funds futures markets (above), where rate cuts that were originally expected in March or May are now being pushed back to September or December, or even later.
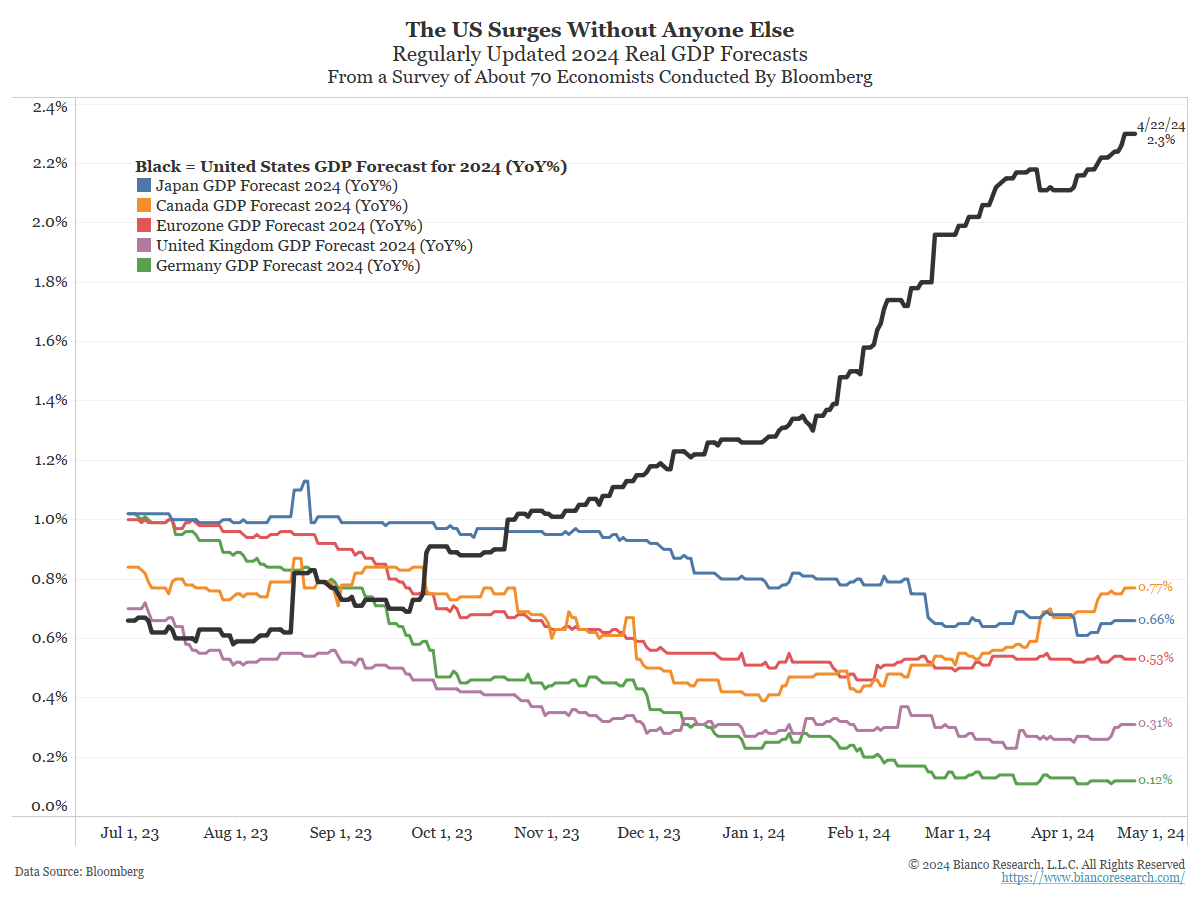
Further putting the prospects for rate cuts at risk is that the U.S. economy continues to look both strong and resilient, and arguably stands alone (black line) as the only economy (except China, if you believe their data) that is expected to maintain an impressive rebound from the pandemic. Of note, while the initial estimate of first quarter economic growth (GDP) just came out with a fairly anemic growth rate of only 1.6% on an annual basis, which is down from 3.4% the previous quarter, we suspect that the weakness is likely overstated. 2
More specifically, we believe that economic growth is being distorted downward by the significant trade imbalance and a decline in inventories, both of which subtract from GDP but, we believe, are actually an indication of the remarkable strength of the American consumer. At any rate, we believe that the economy is likely stronger than this number reflects and that there is even a growing risk that, if the economy does not moderate fairly soon, it could reignite the inflationary pressures of recent years, which would be reason enough for the Fed to delay and/or limit any cutting of interest rates.
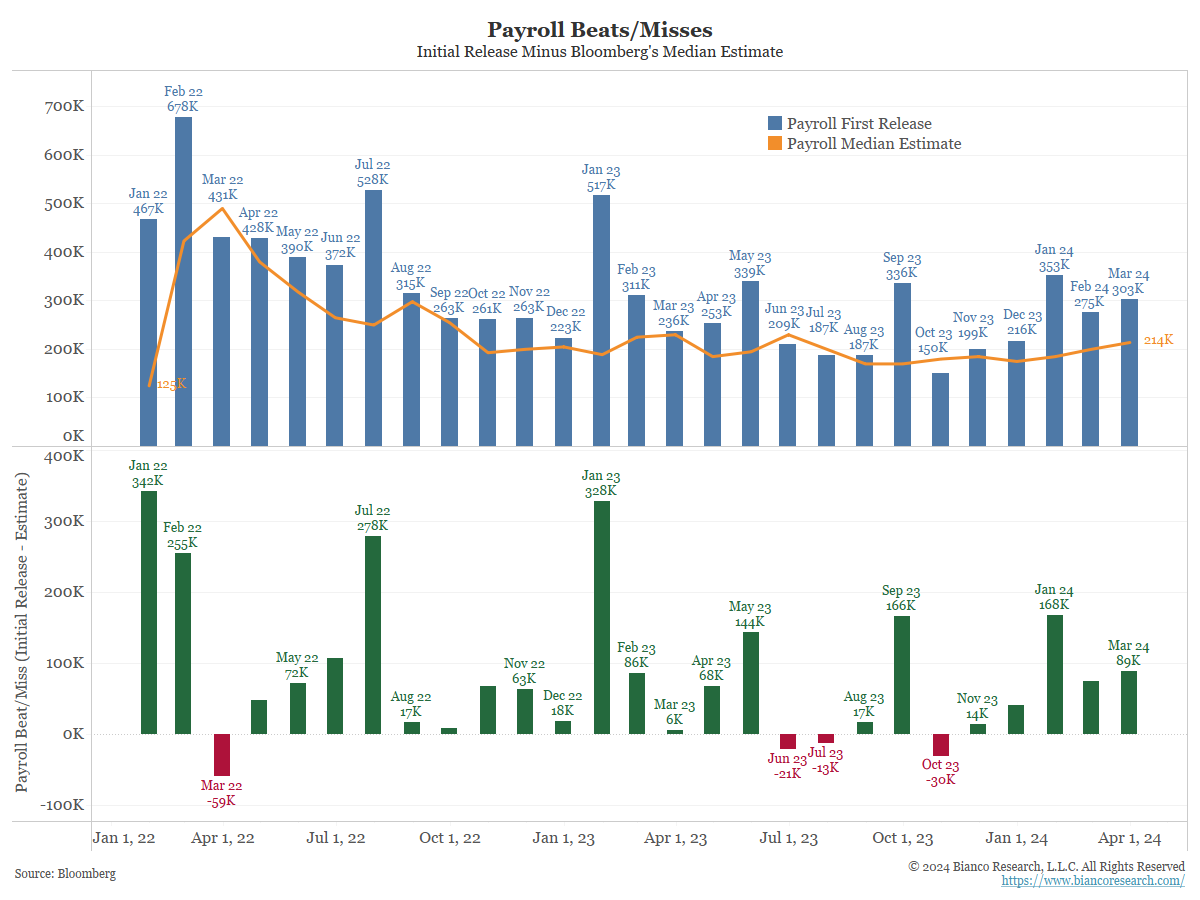
Further, contrary to previous expectations for modest job losses, the U.S. job market remains very tight and job growth continues to exceed expectations (below). Indeed, if not for surges in worker productivity, immigration, and the labor force participation rate, the U.S. would likely be facing significant labor inflation. As it is, unit labor costs have fallen sharply, which has helped to keep inflation from rebounding even more substantially.
Even so, such an abundance of “good” news brings into question the need for the Fed to cut rates in any substantial way, if even at all, and particularly with inflation remaining well above the Fed’s 2% target.
Even Fed Chairman Powell himself has reversed his previous foreshadowing of rate cuts by the Fed, and on April 16th gave updated guidance that: “More recent data shows solid growth and continued strength in the labor market, but also a lack of further progress so far this year on returning to our 2% inflation goal…The recent data have clearly not given us greater confidence, and instead indicate that it’s likely to take longer than expected to achieve that confidence…That said, we think policy is well positioned to handle the risks that we face…We can maintain the current level of restriction [i.e., high rates] for as long as needed.” 3
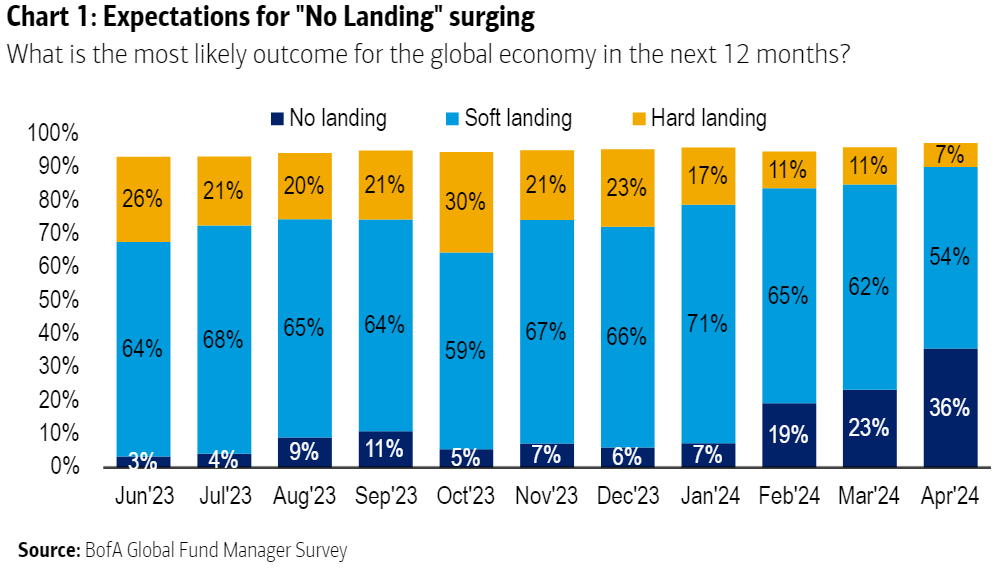
In short, it has become increasingly unlikely that investors are going to see either the economic slowdown or the rate cuts that they have been so eagerly awaiting. This new reality is reflected in the most recent Bank of America Global Fund Manager Survey (above).
In sharp contrast to the aforementioned December survey, where only 6% of polled managers were expecting the economy to avoid a slowdown, a full 36% of managers had adopted that opinion as of the above April of 2024 survey.
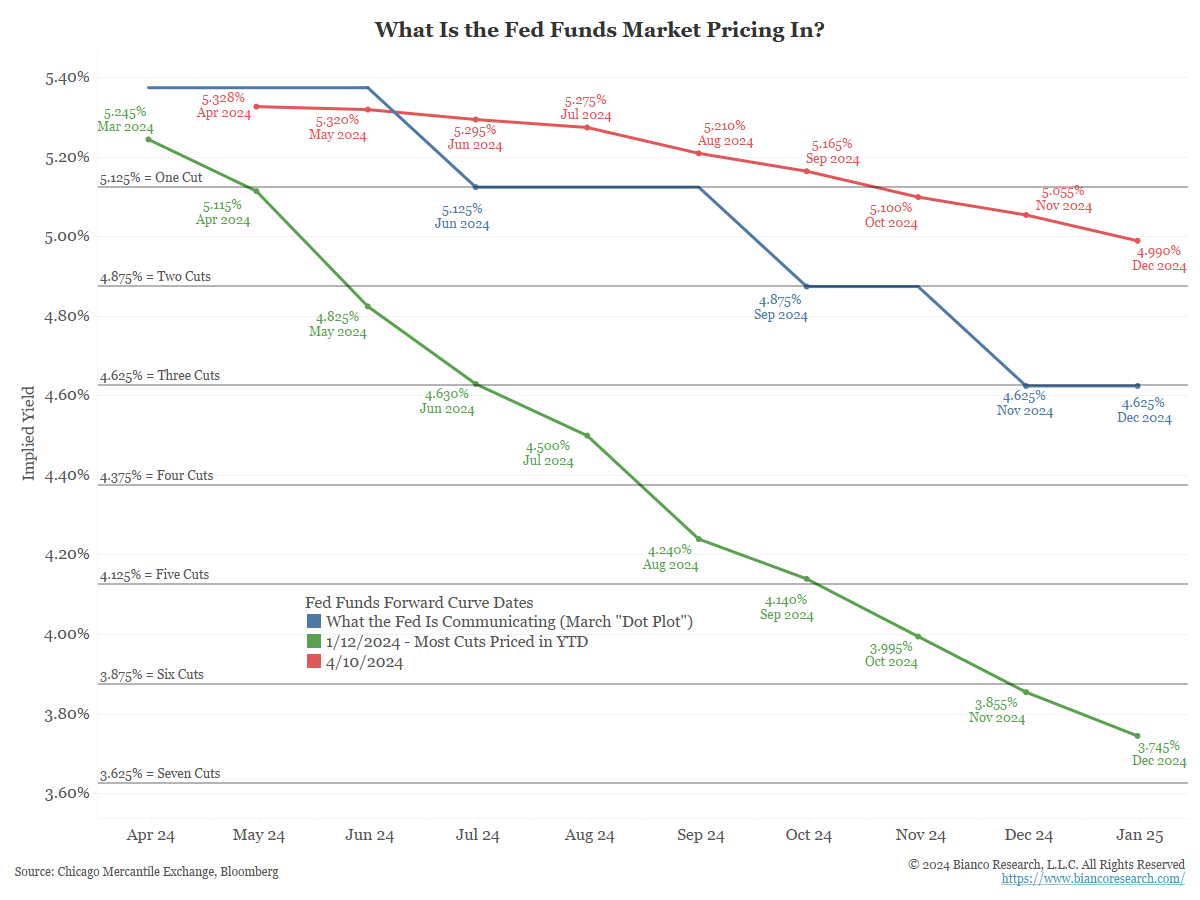
Further, instead of the six or seven rate cuts expected by the markets for 2024 (green line) back in January, expectations have since been slimmed down to only one or two cuts (red line) for the year, and that impacts the stock and bond markets.
The most obvious and direct impact of this change is on the debt and credit markets, as lower inflation and lower interest rates drive the prices of bonds, bills and notes to higher levels.
The impact on the equity markets is less direct, but potentially equally powerful, as lower rates normally produce a phenomenon called “multiples expansion”, which is simply Wall Street’s way of defining an environment in which investors are willing to pay a larger share price relative to each dollar of corporate earnings.
This is likely of particular importance in the current environment when the S&P 500 Index is already selling at almost 21 times its expected earnings, and because higher interest rates historically depress high equity valuations.
Interest rate expectations traditionally have a particularly important impact on the part of a stock’s share price that is attributable to optimism about the future and other intangibles, rather than the more tangible components like a company’s book value (its total assets minus its total liabilities) and its expected earnings.
High and/or increasing interest rates also enhance the attractiveness of bonds versus stocks; reduce the value that investors are willing to pay for future earnings, and increase debt servicing costs thus diminishing profitability.
This dimunition of the value assigned to future earnings is particularly challenging for the stocks of technology and innovation-oriented companies, that are favored by investors more for their future earnings potential than the earnings that they generate today. They are also challenging for stocks of smaller companies who, on average, have more than 40% of their debt in the form of floating-rate loans, which adjust as rates change, or short-term debt that may need to be refinanced amid the higher rate environment. 4
Just as expectations for lower rates drove dramatic gains in the first quarter, expectations for rates now staying higher than expected for longer than expected have recently catalyzed a correction from the year-to-date highs. As noted on April 19th in Bloomberg, “The bad news on Wall Street this week has some thinking the big boom of 2024 has come to an end. The rally looks close to unraveling as would-be bulls turn tail and run, and money is pulled out of equities and junk bonds at the fastest rate in more than a year.” 5
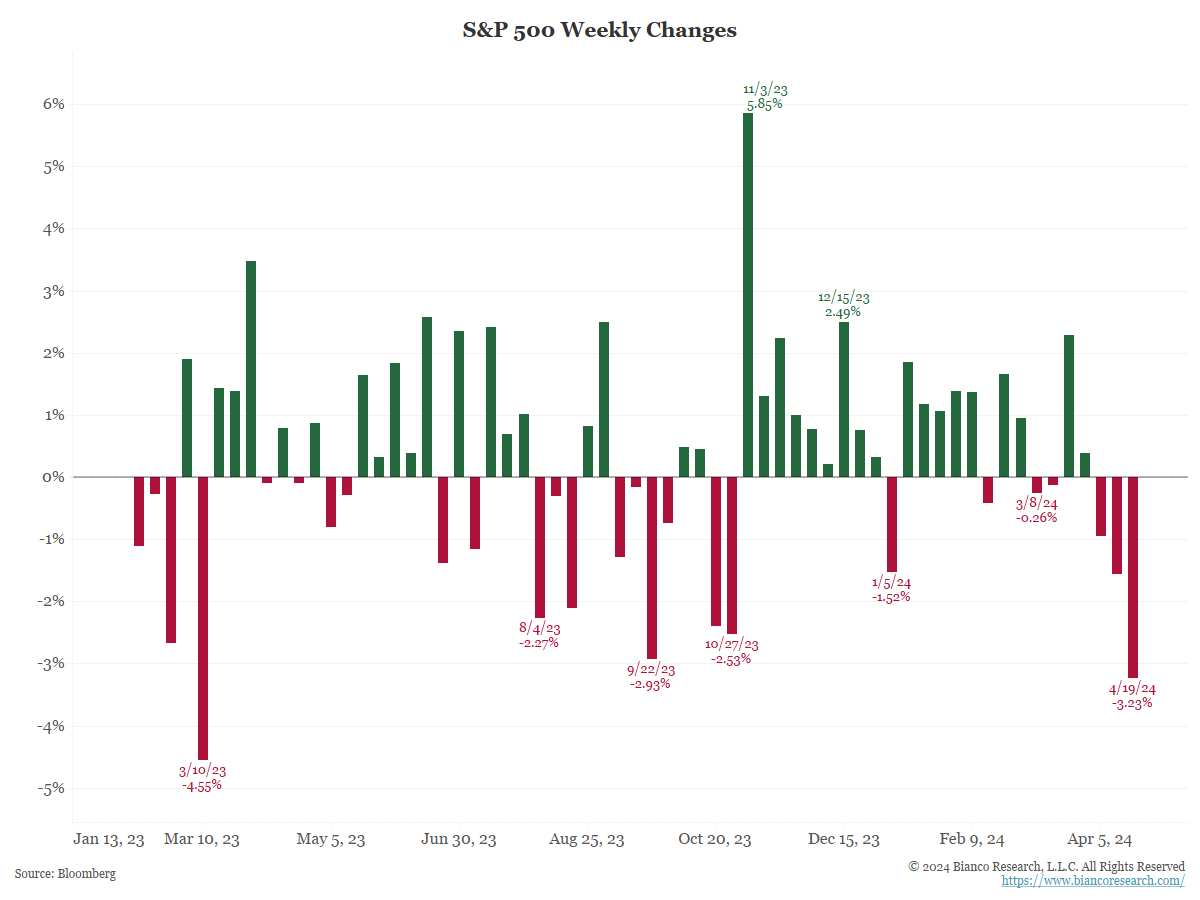
For our part, we are more inclined to view this as little more than a garden variety correction that the equity markets were arguably very overdue for. By the start of April, equity valuations were very high, sentiment was egregiously bullish, and the S&P 500 had experienced an almost uninterrupted advance since the October lows.
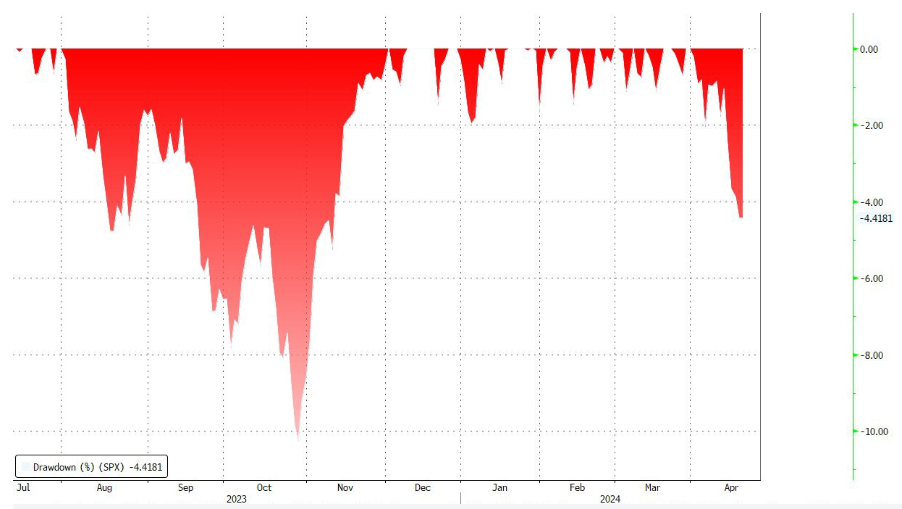
Indeed, as is illustrated in the above drawdown chart for the S&P 500 the market had not seen a net decline of as much as 2%6 in over four months, which is remarkable. Put another way, the S&P 500 had gained a whopping 27%7 in the five months between the last week in October and the last week in March without so much as a single 2% backwards step.6
Such suppressed volatility is very rare, particularly when you consider that, since 1928, the U.S. stock market has experienced a double-digit correction on average once every year-and-a-half or so and a bear market (a 20% or greater decline) once every four years.8
To carry forward our initial analogy, we think that investors went to the ice cream parlor with their mouths all set for mint chip only to find out that they could only have pistachio. It’s not that pistachio is a bad outcome. It is just that it is not what investors were looking forward to. To wit, investors spent those five months driving markets higher under the premise that the Fed would start cutting rates aggressively.
However, with rates now likely to remain higher for longer, it will mean that investors will instead need to rely upon improving corporate earnings rather than lower rates to drive equity prices higher. Fortunately, that is not an unreasonable expectation in an economy that continues to impress on the upside. Indeed, Wall Street analysts are already predicting annualized earnings growth of 9% or more for the second, third and fourth quarters of this year.
Yes, the “bad” news is that the economy is strong and apparently resilient, the labor market remains very strong, and consumer spending remains remarkably robust, all of which suggest that the markets are unlikely to get their highly desired relief from higher rates any time soon. In contrast, the “good” news is that it would be very unusual for a bull market to end because the economy (and therefore likely earnings) is too strong.
Of note, we believe that the outlook for interest rates will remain of great importance for almost all financial assets, and do not believe that interest rates have yet reached their highs. Further, until there is more agreement on where rates are ultimately likely to peak, it will be challenging to call an end to the current correction in stock and bond prices.
That said, there are some indications that sentiment is already getting overly bearish regarding both asset classes. Surges in bearishness tend to suggest that most potential sellers have already sold, and market lows tend to take place at the point of maximum bearishness.
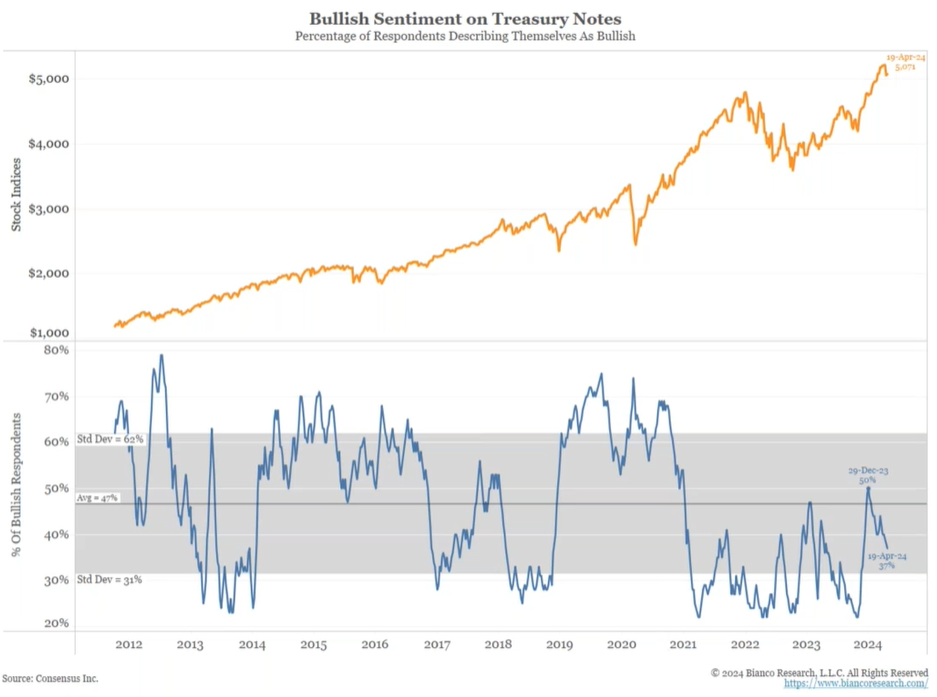
We will look at sentiment through three of our preferred measures, starting with an April 19th survey of investment newsletter writers (above). At present, only 37% of respondents are bullish on bonds, which is well below the average of 47%, and could suggest that the bond market is running out of potential sellers.
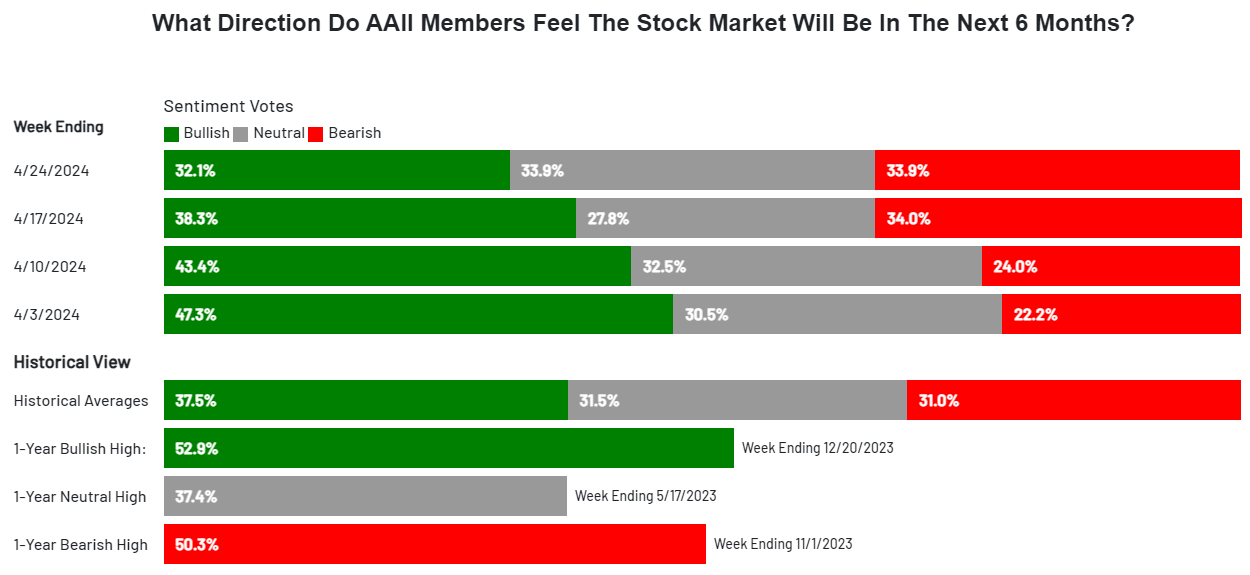
We are seeing similar indications of potential seller exhaustion in the equity markets. Starting with the American Association of Individual Investors (AAII) sentiment survey9, which shows that bears now outnumber bulls, which tends to occur near market lows. Indeed, the survey currently reflects the highest bearish sentiment since last November10 and could be yet another indicator that the markets are running out of potential sellers.
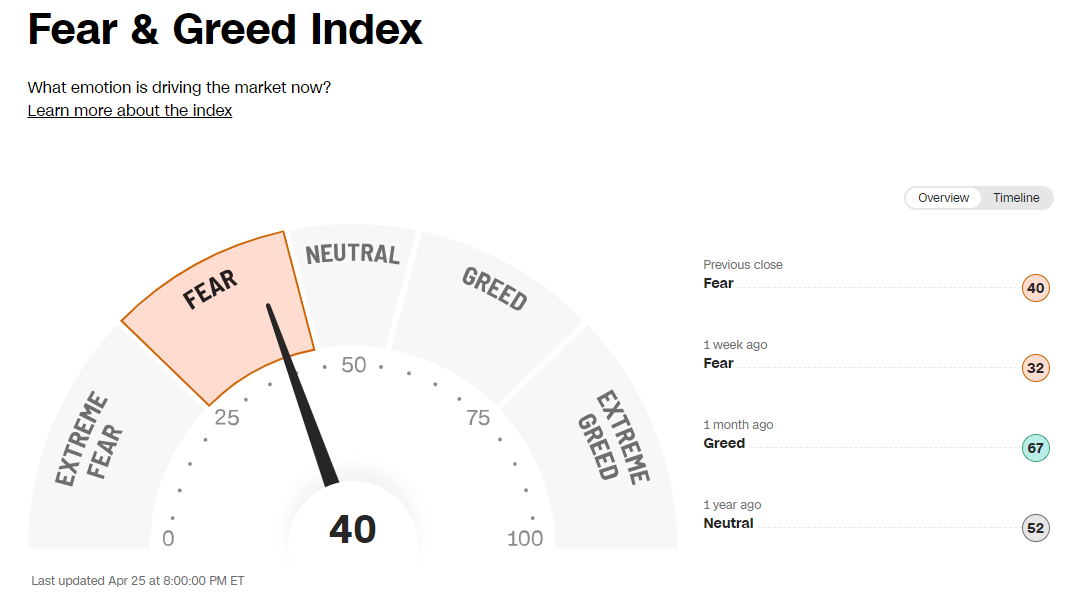
Another useful measure that we track is the CNN Fear and Greed Index11, which is a measure of risk appetite in the markets, and also operates under the premise that market lows take place at the point of maximum pessimism. After indicating investor “greed” a month ago and “extreme greed” through most of the first quarter, this indicator suggests that “fear” is now the dominant investor emotion and thus could provide yet another indication that we are approaching the point of maximum pessimism.
Remember the sage advice of Warren Buffett that investors should “be fearful when others are greedy and greedy when others are fearful”.
Disclosures
Advisory services offered through Per Stirling Capital Management, LLC. Securities offered through B. B. Graham & Co., Inc., member FINRA/SIPC. Per Stirling Capital Management, LLC, DBA Per Stirling Private Wealth and B. B. Graham & Co., Inc., are separate and otherwise unrelated companies.
This material represents an assessment of the market and economic environment at a specific point in time and is not intended to be a forecast of future events, or a guarantee of future results. Forward-looking statements are subject to certain risks and uncertainties. Actual results, performance, or achievements may differ materially from those expressed or implied. Information is based on data gathered from what we believe are reliable sources. It is not guaranteed as to accuracy, does not purport to be complete and is not intended to be used as a primary basis for investment decisions. It should also not be construed as advice meeting the particular investment needs of any investor.
Nothing contained herein is to be considered a solicitation, research material, an investment recommendation or advice of any kind. The information contained herein may contain information that is subject to change without notice. Any investments or strategies referenced herein do not take into account the investment objectives, financial situation or particular needs of any specific person. Product suitability must be independently determined for each individual investor.
This document may contain forward-looking statements based on Per Stirling Capital Management, LLC’s (hereafter PSCM) expectations and projections about the methods by which it expects to invest. Those statements are sometimes indicated by words such as “expects,” “believes,” “will” and similar expressions. In addition, any statements that refer to expectations, projections or characterizations of future events or circumstances, including any underlying assumptions, are forward-looking statements. Such statements are not guarantying future performance and are subject to certain risks, uncertainties and assumptions that are difficult to predict. Therefore, actual returns could differ materially and adversely from those expressed or implied in any forward-looking statements as a result of various factors. The views and opinions expressed in this article are those of the authors and do not necessarily reflect the views of PSCM’s Investment Advisor Representatives.
Neither asset allocation nor diversification guarantee a profit or protect against a loss in a declining market. They are methods that can be used to help manage investment risk.
Past performance is no guarantee of future results. The investment return and principal value of an investment will fluctuate so that an investor’s shares, when redeemed, may be worth more or less than their original cost. Current performance may be lower or higher than the performance quoted.
Definitions
The Standard & Poor’s 500 (S&P 500) is a market-capitalization-weighted index of the 500 largest publicly-traded companies in the U.S with each stock’s weight in the index proportionate to its market. It is not an exact list of the top 500 U.S. companies by market capitalization because there are other criteria to be included in the index.
The Nasdaq Composite index tracks the performance of about 3,000 stocks traded on the Nasdaq exchange. It’s mainly used as an indicator of how well companies in the tech sector – both large and small – are doing.
Dow Jones Industrial Average is a price-weighted average of 30 actively traded blue-chip stocks, primarily industrials including stocks that trade on the New York Stock Exchange. The Dow, as it is called, is a barometer of how shares of the largest US companies are performing.
The Russell 2000 Index measures the performance of approximately 2,000 small-cap companies in the Russell 3000 Index, which is made up of 3,000 of the biggest U.S. stocks. The Russell 2000 serves as a benchmark for small-cap stocks in the United States.
Real gross domestic product (GDP) is a comprehensive measure of U.S. economic activity. GDP measures the value of the final goods and services produced in the United States (without double counting the intermediate goods and services used up to produce them). Changes in GDP are the most popular indicator of the nation’s overall economic health.
The Consumer Price Index (CPI), which is produced by the Bureau of Labor Statistics, is a measure of the average change over time in the prices paid by urban consumers for a market basket of consumer goods and services. Indexes are available for the U.S. and various geographic areas. Average price data for select utility, automotive fuel, and food items are also available.
Citations
-
“S&P 500 closes at a fresh record, posts strongest first-quarter performance since 2019: Live updates”, Lisa Kailai Han, Posted 3/28/2024, https://www.cnbc.com/2024/03/27/stock-market-today-live-updates.html#:~:text=For%20the%20quarter%2C%20the%20S%26P,quarter%20with%20a%209.1%25%20pop
-
“US economy grew by just 1.6% in the first quarter, a much slower pace than expected”, Bryan Mena, Posted 4/25/2024, https://www.cnn.com/2024/04/25/economy/first-quarter-gdp-economy/index.html
-
“Fed Chair Powell says there has been a ‘lack of further progress’ this year on inflation”, Jeff Cox, Posted 4/16/2024, https://www.cnbc.com/2024/04/16/powell-cites-lack-of-progress-this-year-in-reaching-feds-inflation-goal.html
-
“One of Wall Street’s favorite calls to start 2024 has flopped”, Josh Schafer, Posted 4/19/2024, https://finance.yahoo.com/news/one-of-wall-streets-favorite-calls-to-start-2024-has-flopped-080023694.html?guccounter=1
-
“Wall Street Ends the Week in a ‘Tech Wreck’”, David Rovella, Posted 4/19/2024, https://www.bloomberg.com/news/newsletters/2024-04-19/bloomberg-evening-briefing-wall-street-ends-the-week-in-a-tech-wreck?sref=YfRIauRL
-
“Stop Panic Selling During Market Corrections: Stay Disciplined, Invest Long-Term”, Francesco Casarella, Posted 4/19/2024, https://www.investing.com/analysis/stop-panic-selling-during-market-corrections-stay-disciplined-invest-longterm-200647781
-
“$SPX S&P 500 Large Cap Index”, Stock Charts, As of 3/28/2024, https://stockcharts.com/sc3/ui/?s=%24SPX
-
“How Often Do Bear Markets Occur?”, Ben Carlson, 2/11/2024, https://awealthofcommonsense.com/2024/02/how-often-do-bear-markets-occur/#:~:text=This%20would%20mean%20the%20U.S.,Great%20Depression%20and%20its%20aftermath
-
“The AAII Investor Sentiment Survey”, AAII, As of 4/29/2024, https://www.aaii.com/sentimentsurvey
-
“AAII Sentiment Survey: Pessimism Jumps to Highest Level Since November”, AAII, Posted 4/18/2024, https://www.aaii.com/latest/article/203605-aaii-sentiment-survey-pessimism-jumps-to-highest-level-since-november
-
“Fear & Greed Index”, CNN, As of 4/29/2024, https://www.cnn.com/markets/fear-and-greed
Images
#13 “Stop Panic Selling During Market Corrections: Stay Disciplined, Invest Long-Term”, Francesco Casarella, Posted 4/19/2024, https://www.investing.com/analysis/stop-panic-selling-during-market-corrections-stay-disciplined-invest-longterm-200647781
#16 “The AAII Investor Sentiment Survey”, AAII, As of 4/29/2024, https://www.aaii.com/sentimentsurvey
#17 “Fear & Greed Index”, CNN, As of 4/29/2024, https://www.cnn.com/markets/fear-and-greed